
ProxMenux Monitor
A modern, responsive dashboard for monitoring Proxmox VE systems built with Next.js and React.
Table of Contents
- Overview
- Features
- Technology Stack
- Installation
- Authentication & Security
- API Documentation
- Integration Examples
- License
Overview
ProxMenux Monitor is a comprehensive, real-time monitoring dashboard for Proxmox VE environments. Built with modern web technologies, it provides an intuitive interface to monitor system resources, virtual machines, containers, storage, network traffic, backups, health status and system logs — all from a single browser tab.
The application runs as a standalone AppImage on your Proxmox server and serves a web interface accessible from any device on your network.
Full documentation: proxmenux.com/docs/monitor — per-feature walkthroughs, API reference and integration guides.
Screenshots
A tour of the Monitor's main areas. See the public documentation for the full walkthrough.
Dashboard overview
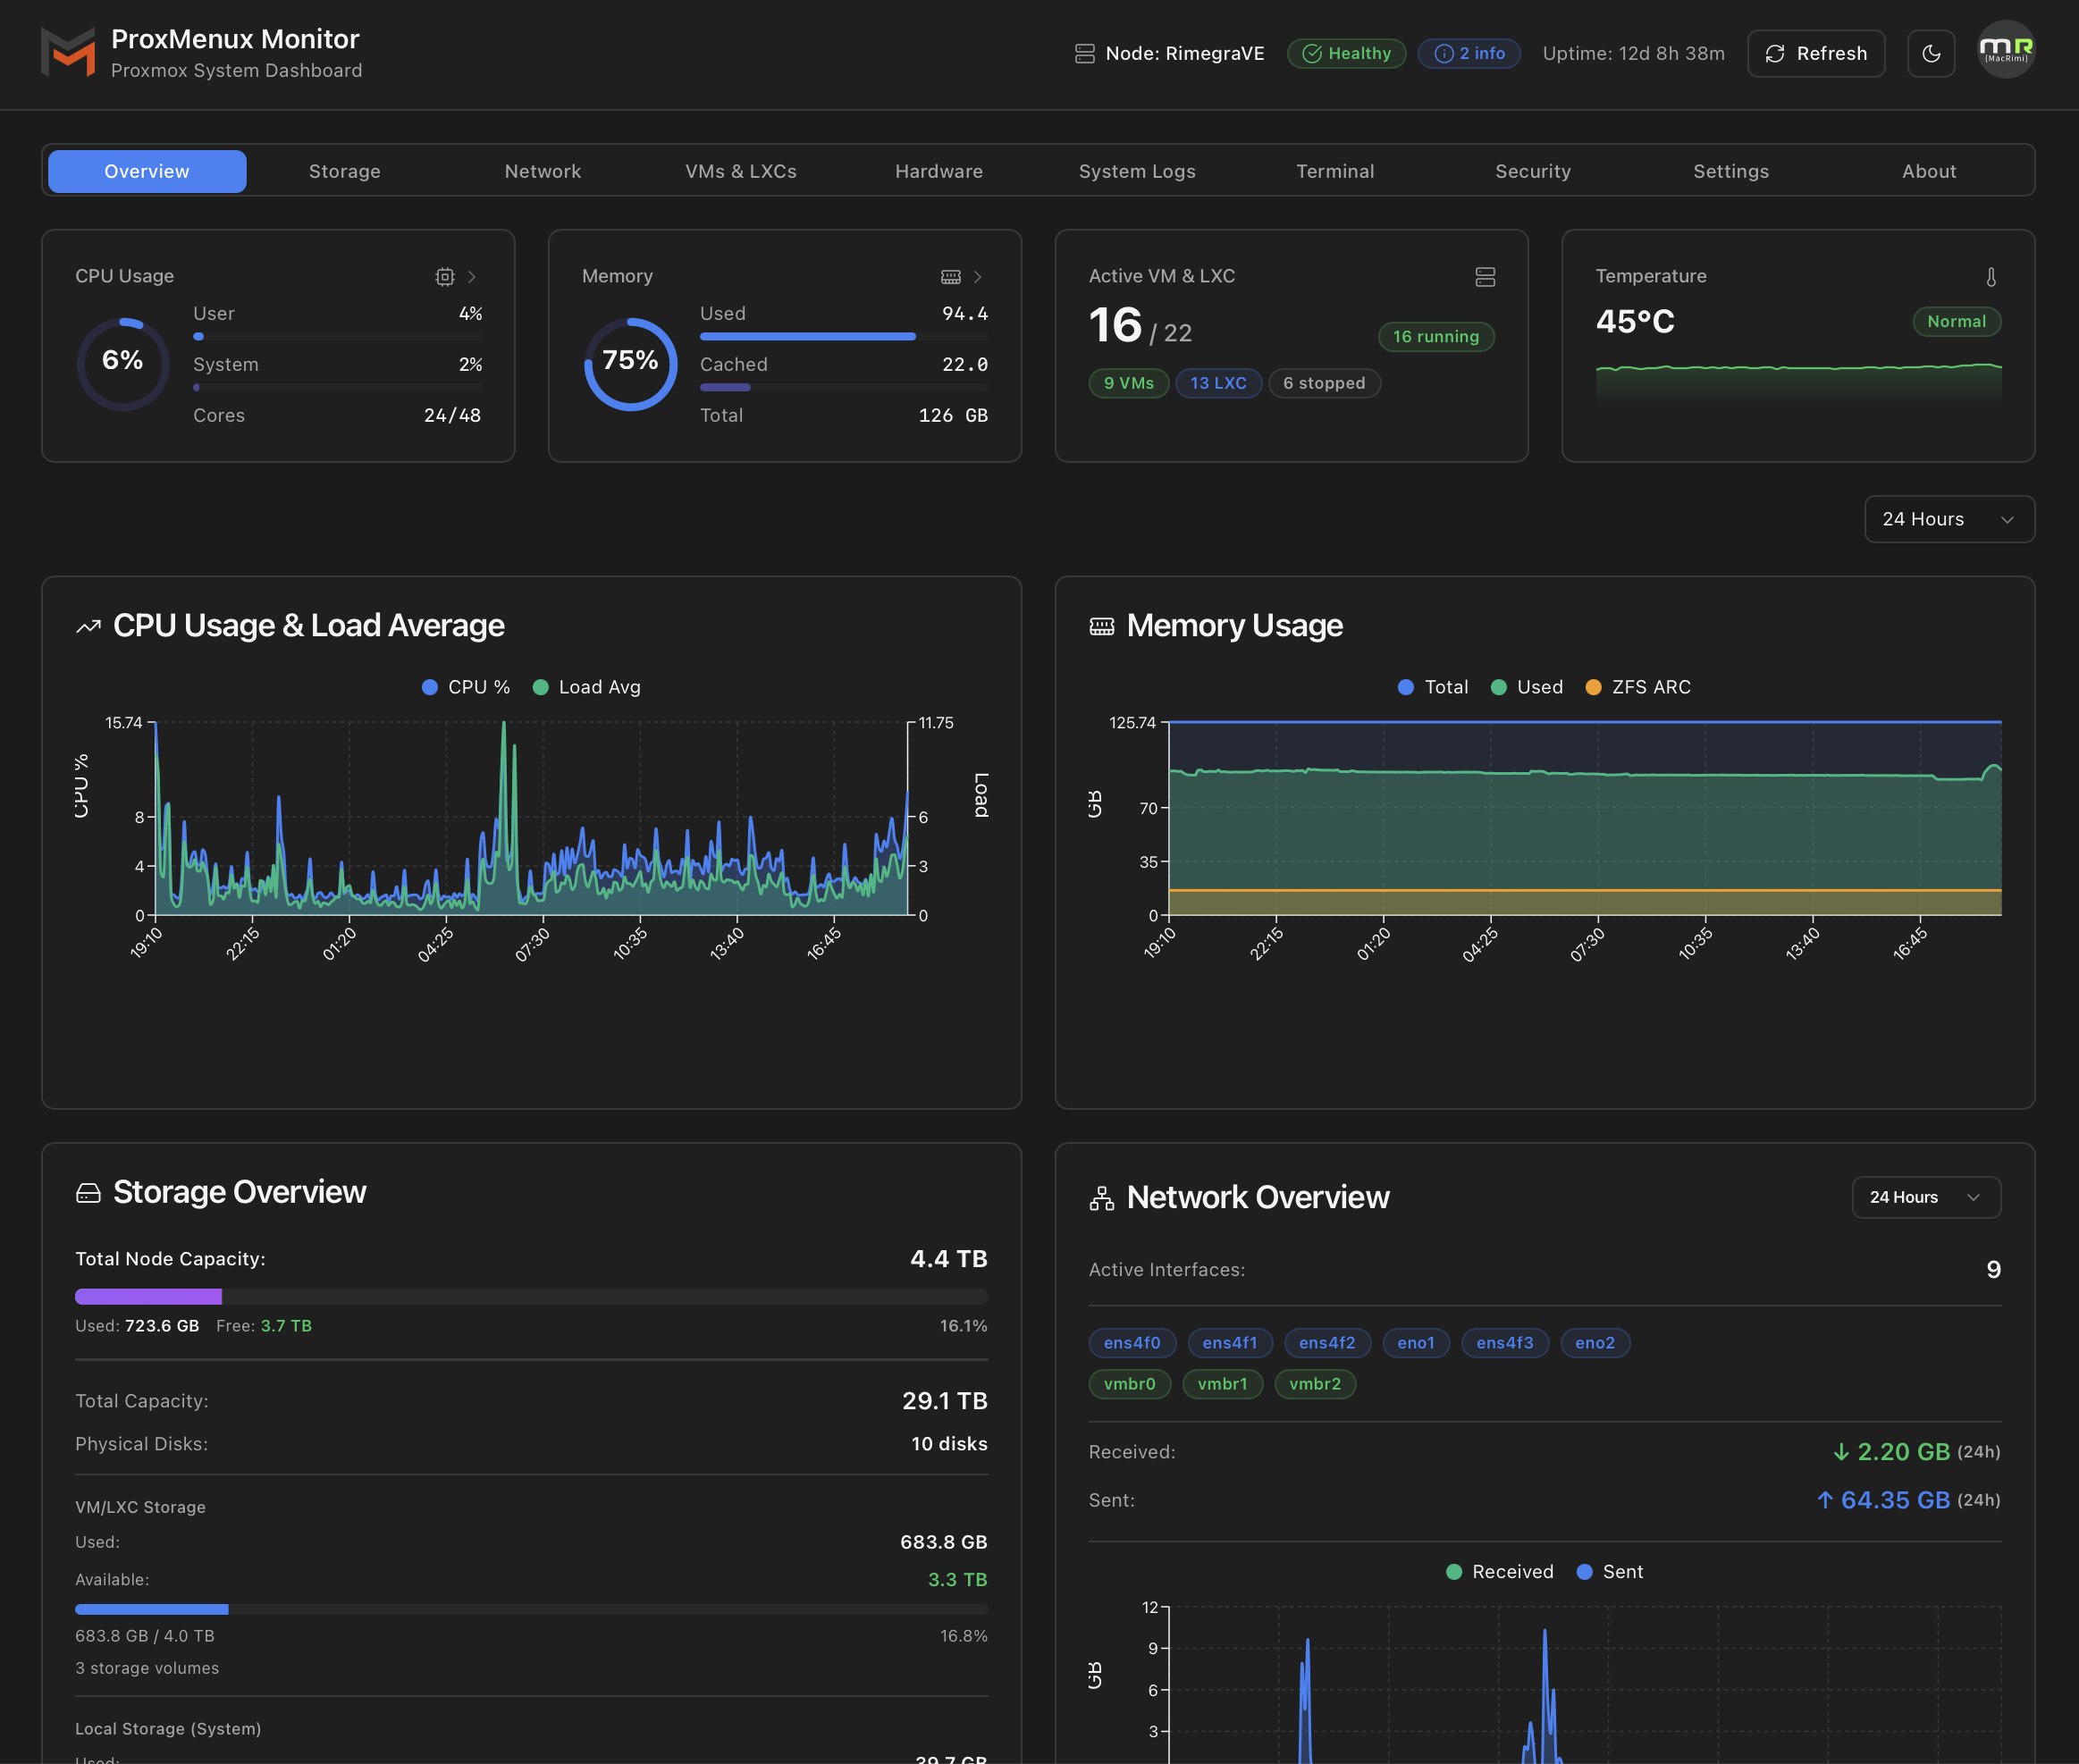
Real-time CPU, memory, temperature, storage and network activity on one glance-optimised page.
Backup & Restore
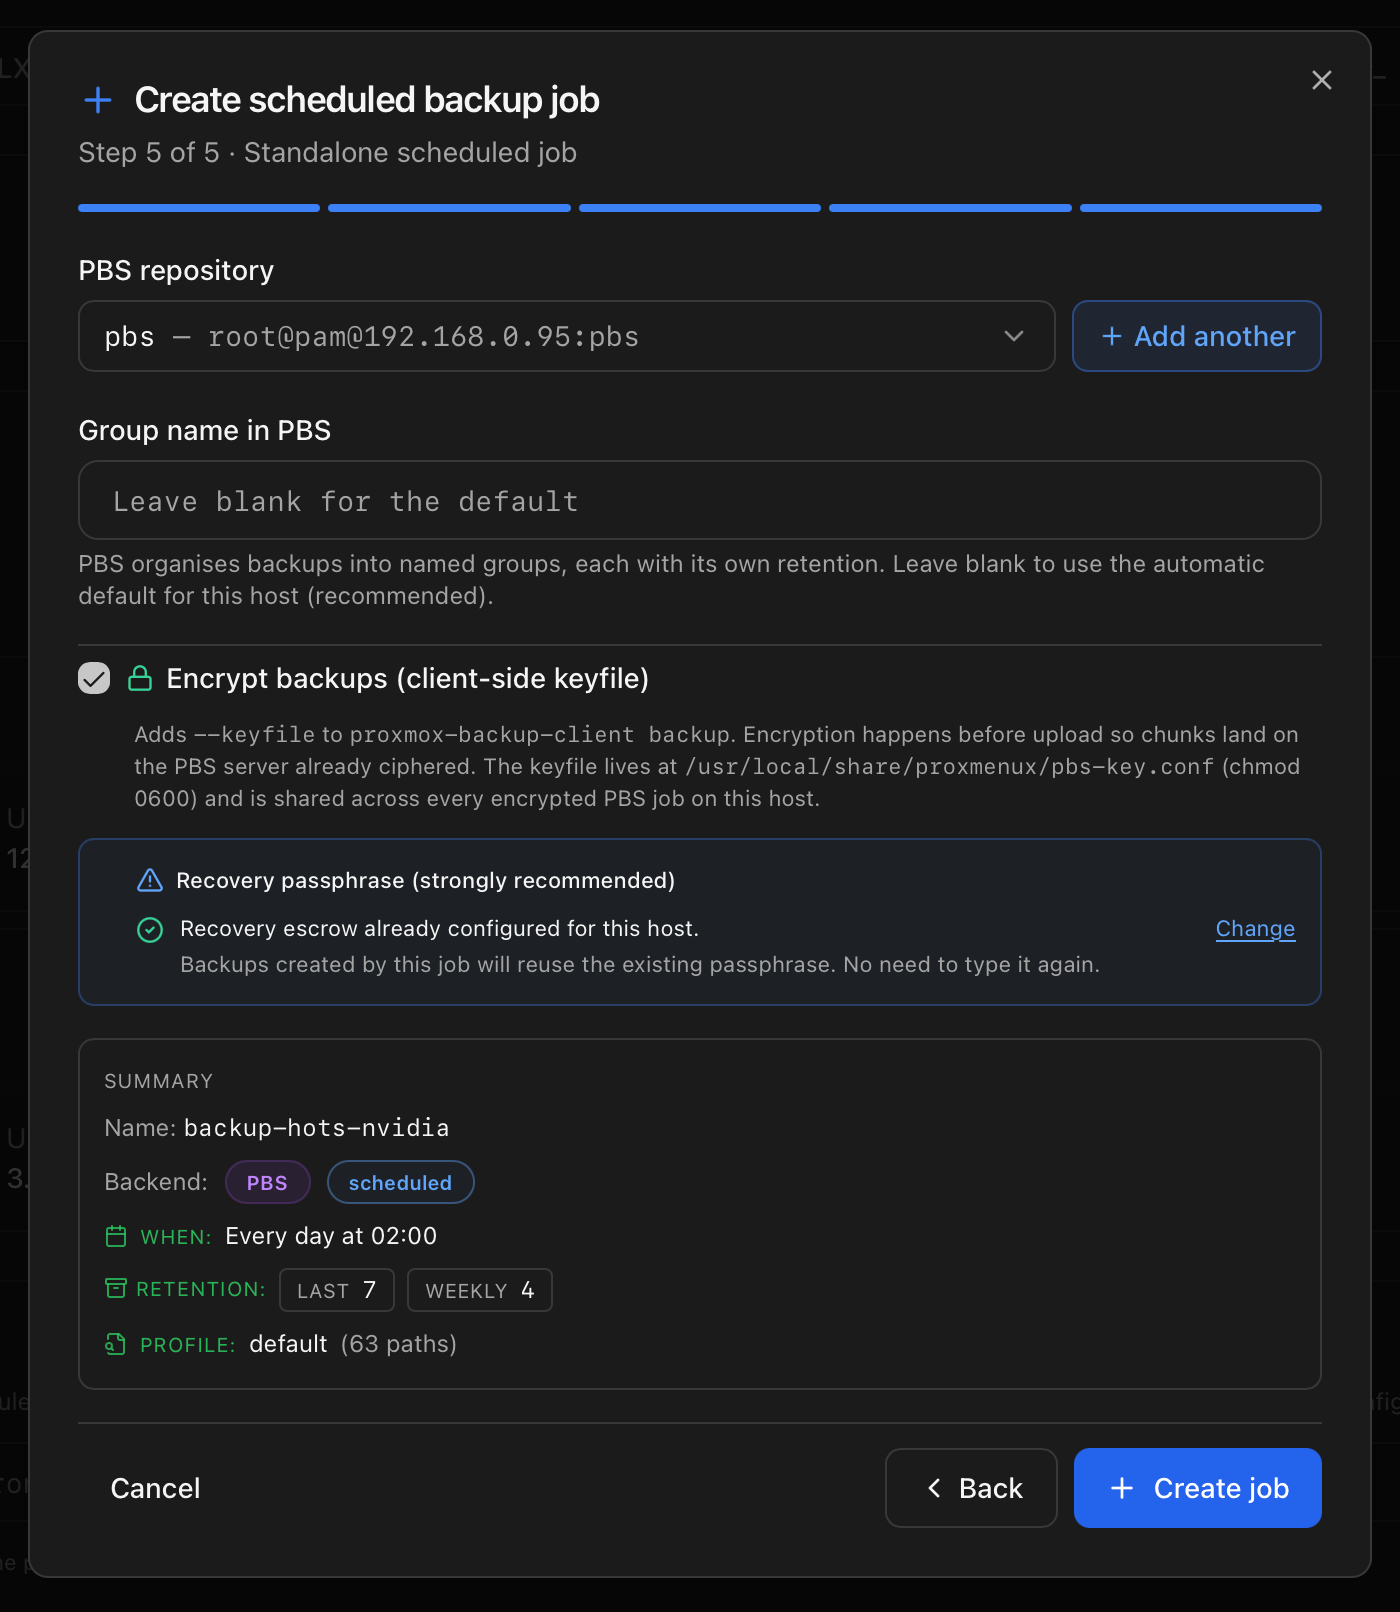
Integrated host backup & restore — Local, PBS or Borg destinations; own timer or attached to a PVE vzdump job with live-inherited retention; PBS encryption with paired recovery blobs; direction-aware cross-kernel restore.
Storage & SMART
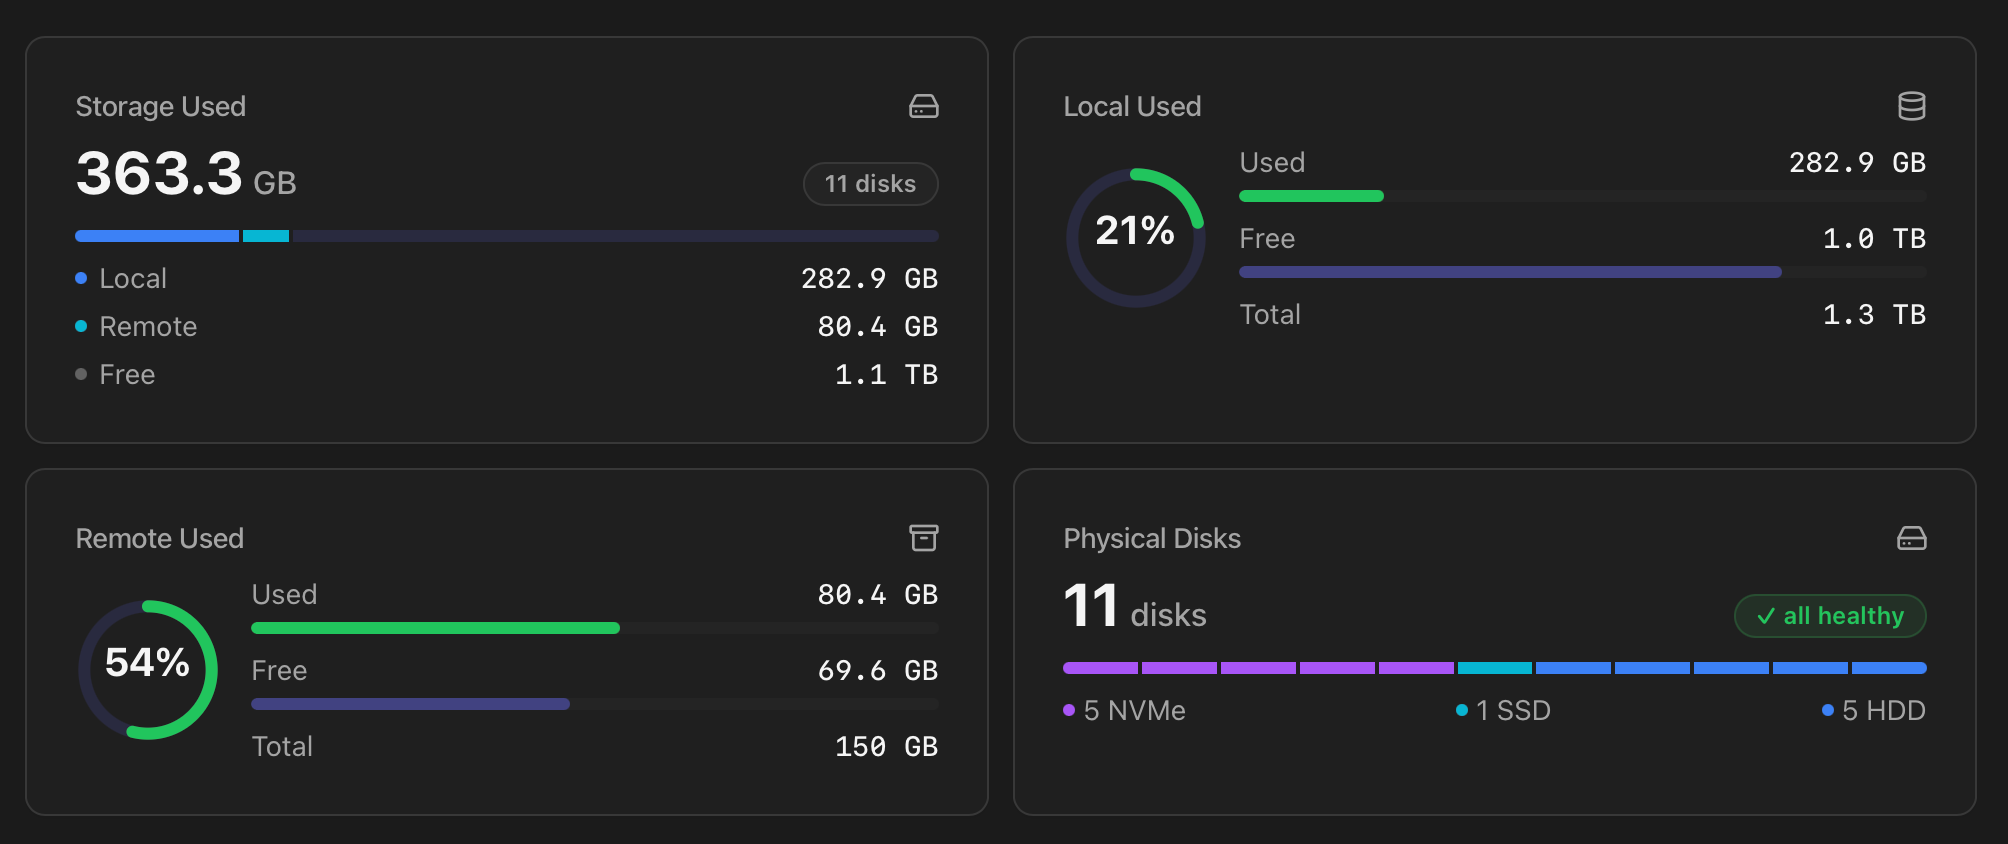
Per-disk cards with capacity palette shared across Storage and Backups. USB-NVMe enclosures (ASMedia / JMicron / Realtek) show the drive's real identity and temperature, not the bridge.
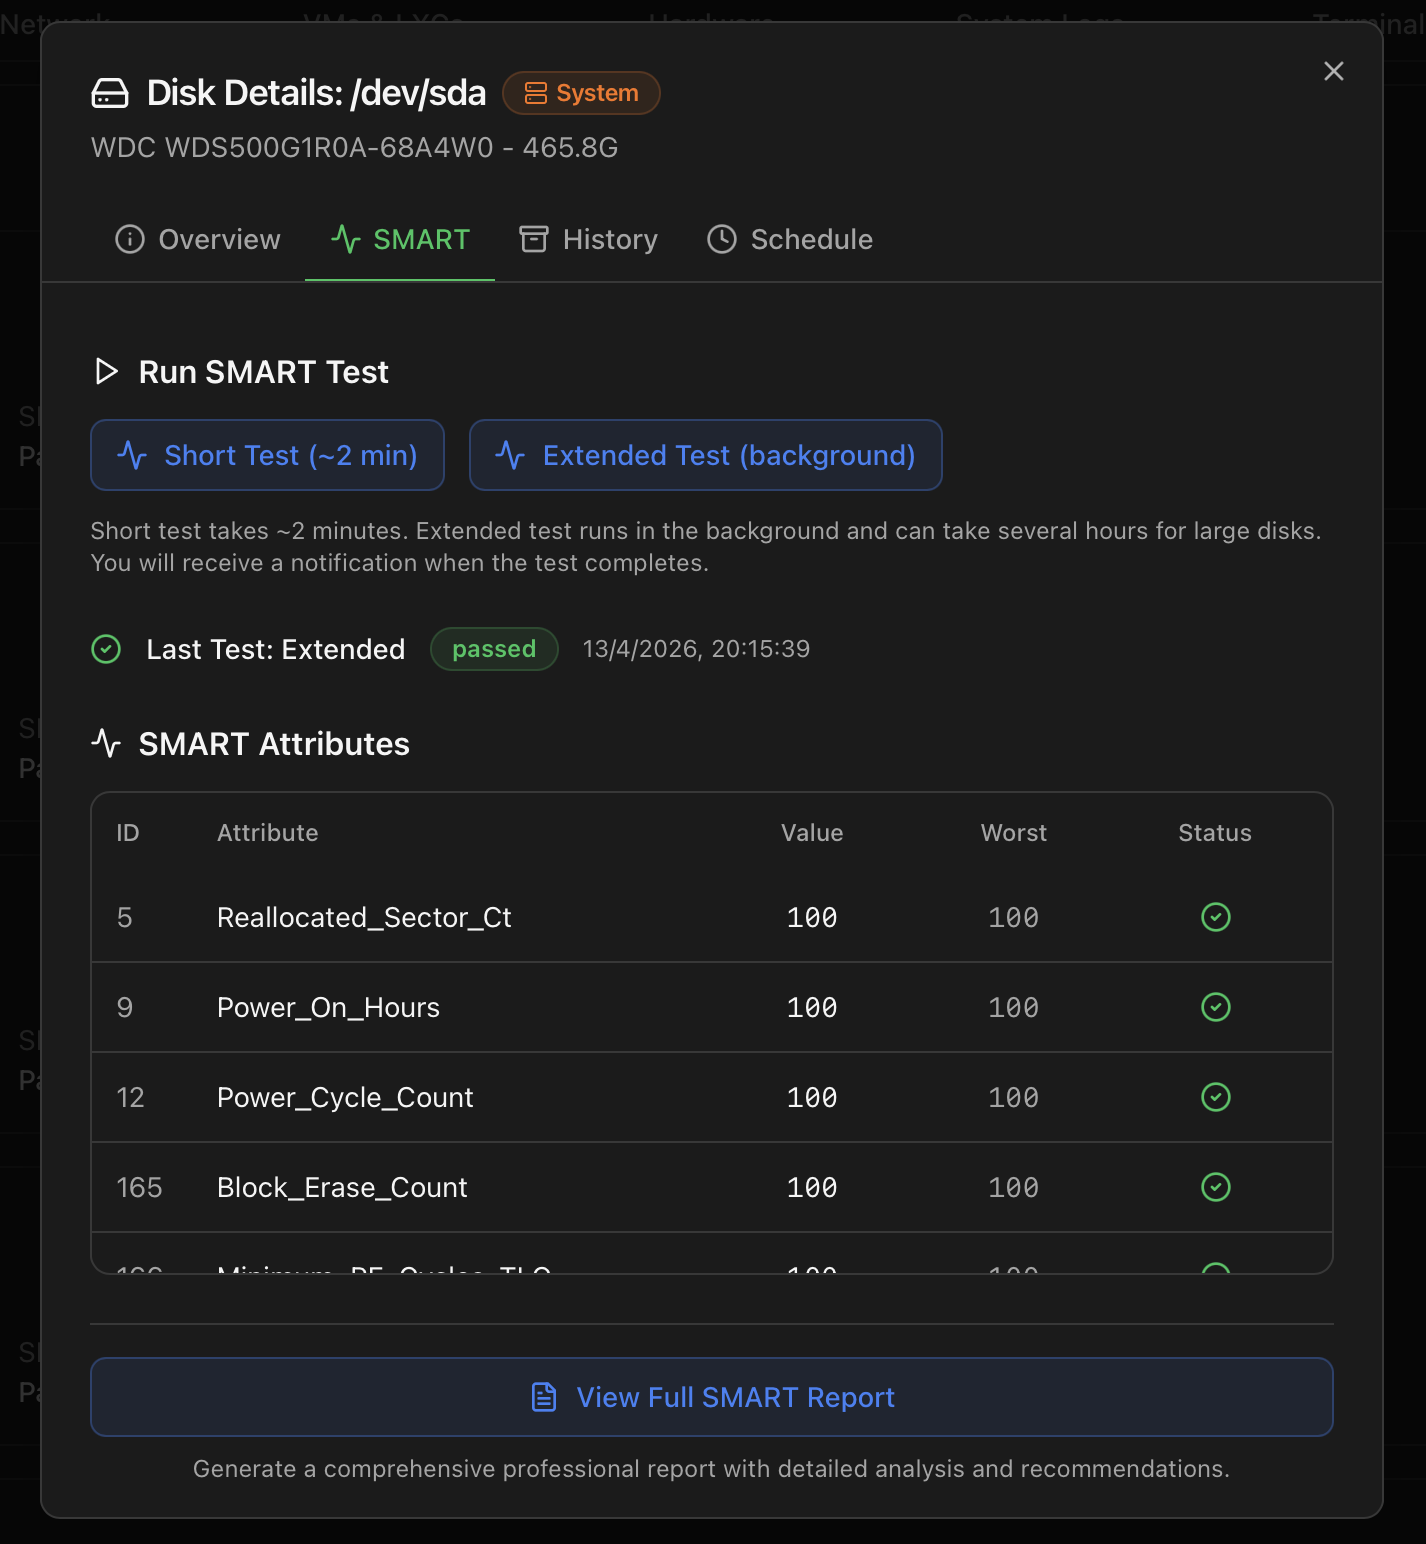
Per-disk detail modal — SMART attributes, temperature history, observations and downloadable PDF report.
Network — live topology
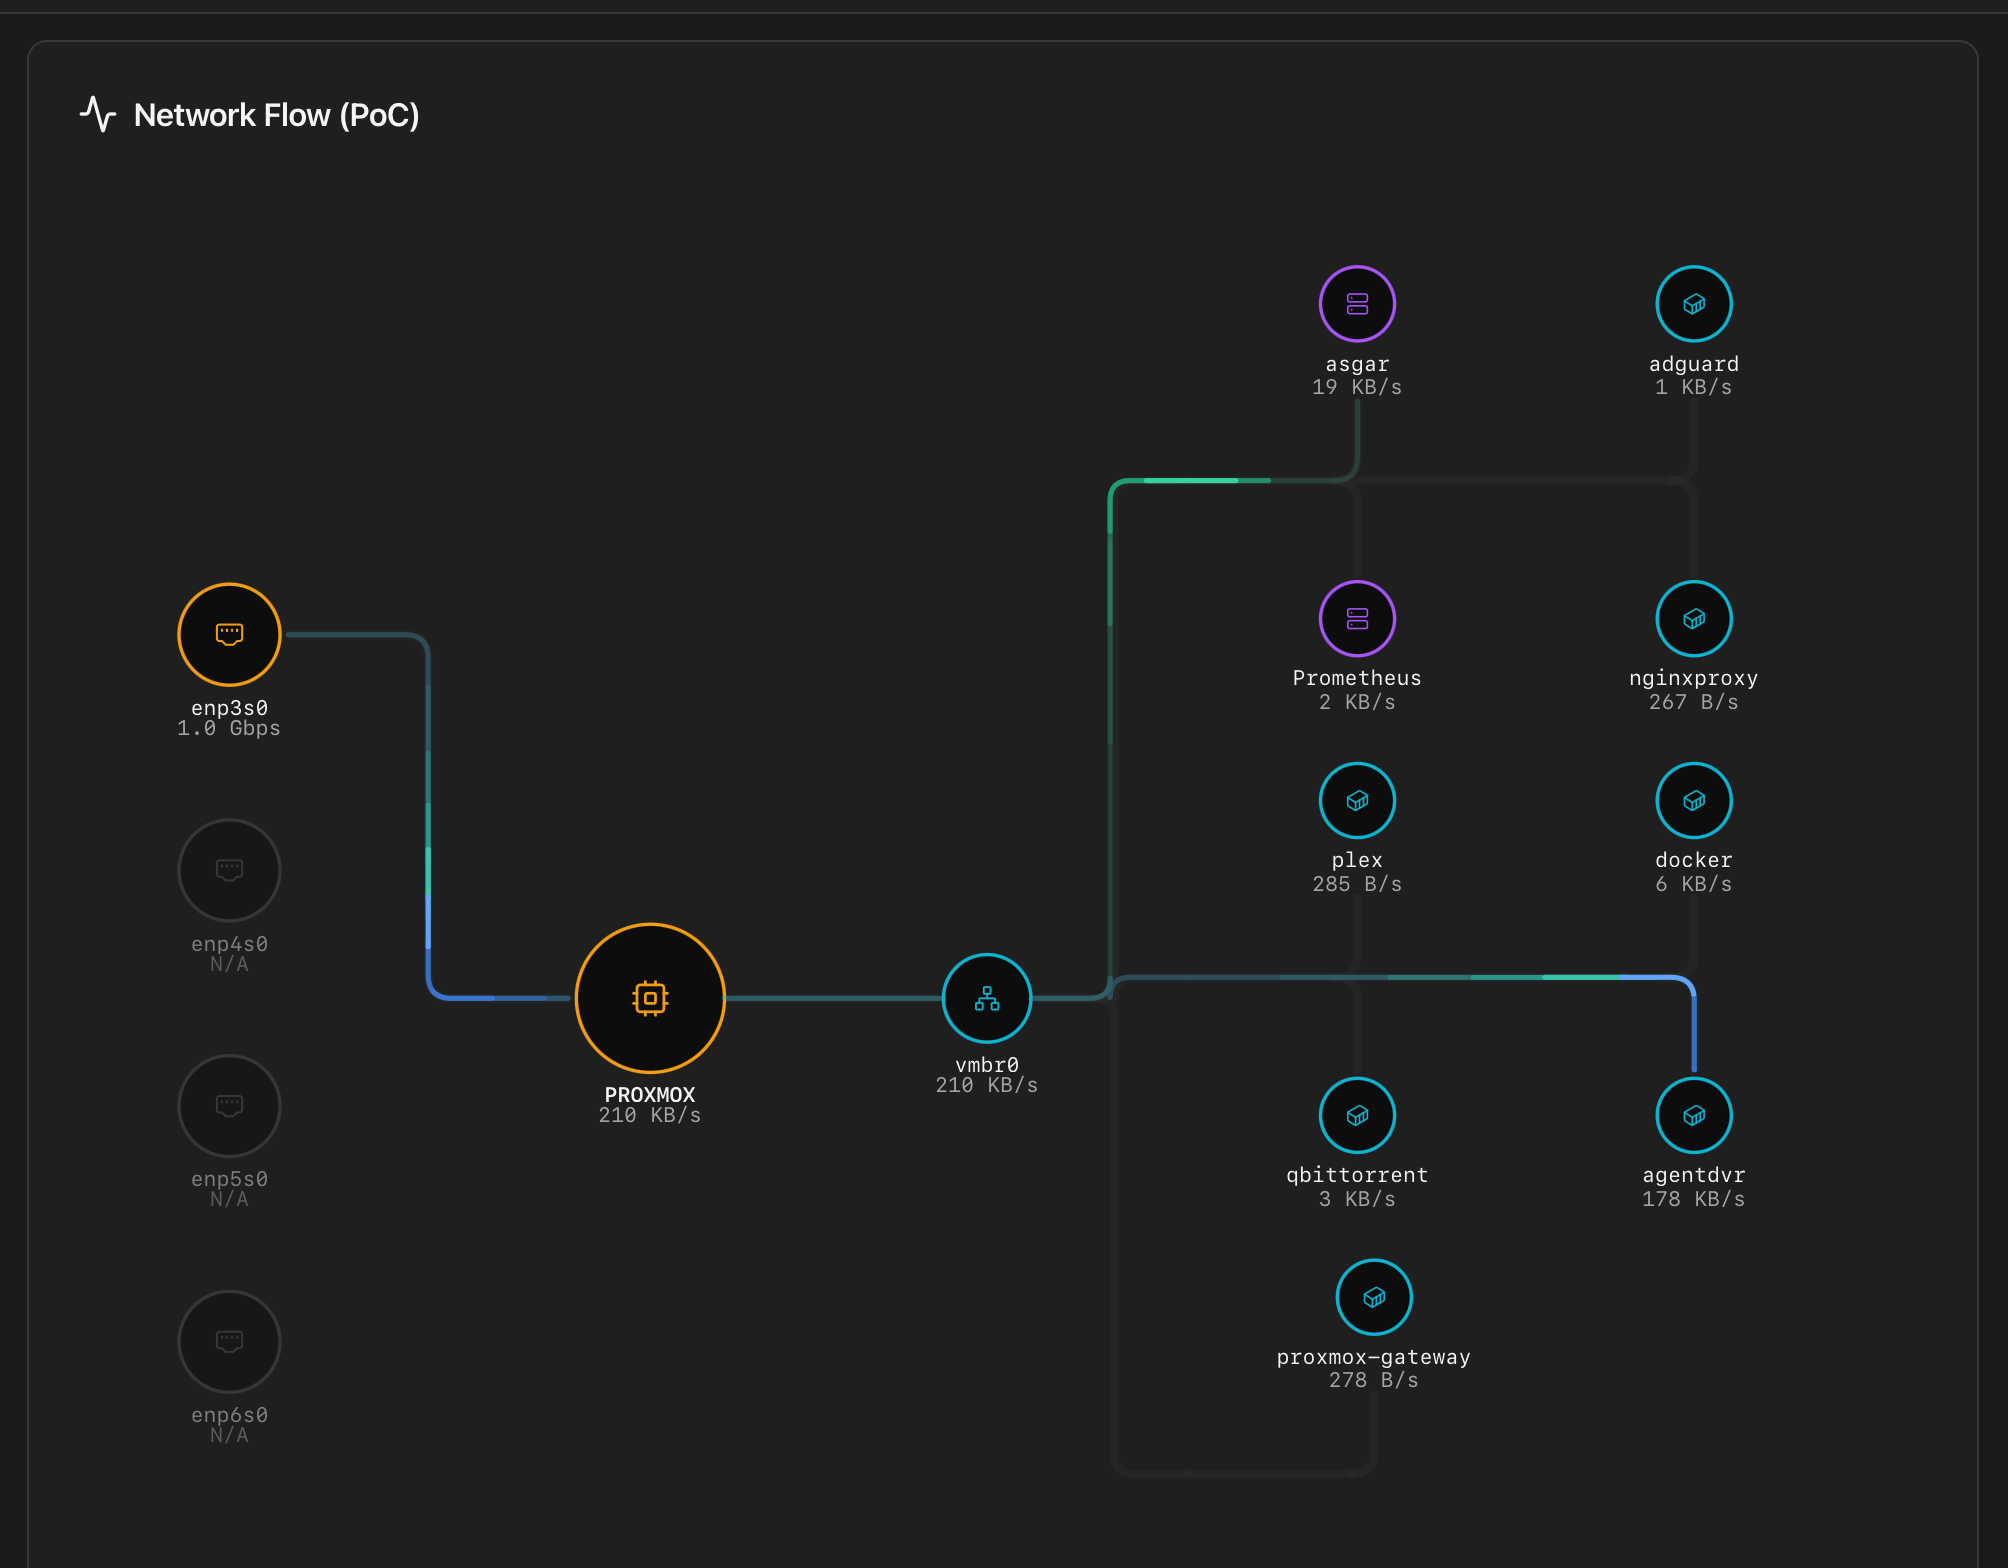
Network Flow — live view of NICs → host → bridges → guests with animated rx / tx pulses on every link. Bridges without active guests are hidden.
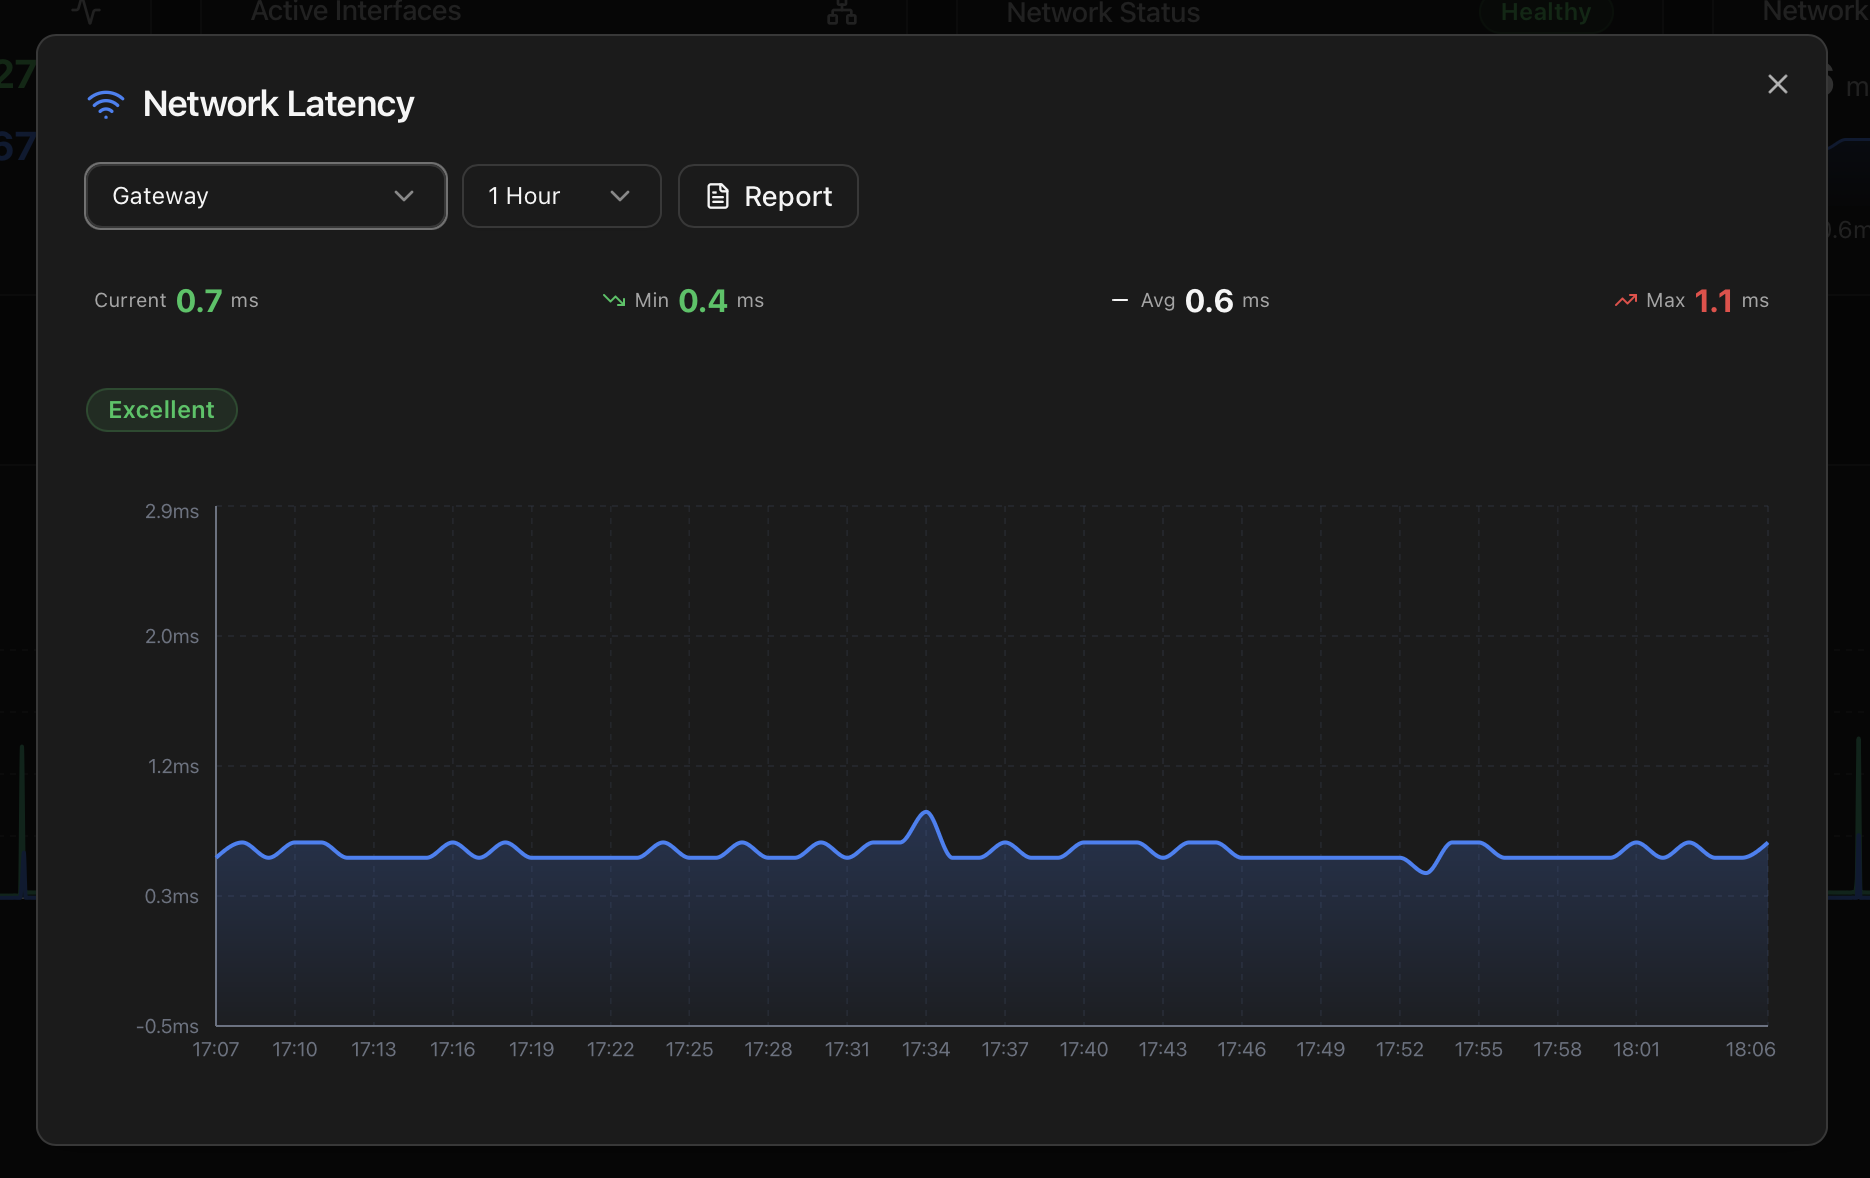
Latency modal — historical view and real-time ping test against Gateway / Cloudflare / Google, with a downloadable PDF report.
Virtual machines & LXCs
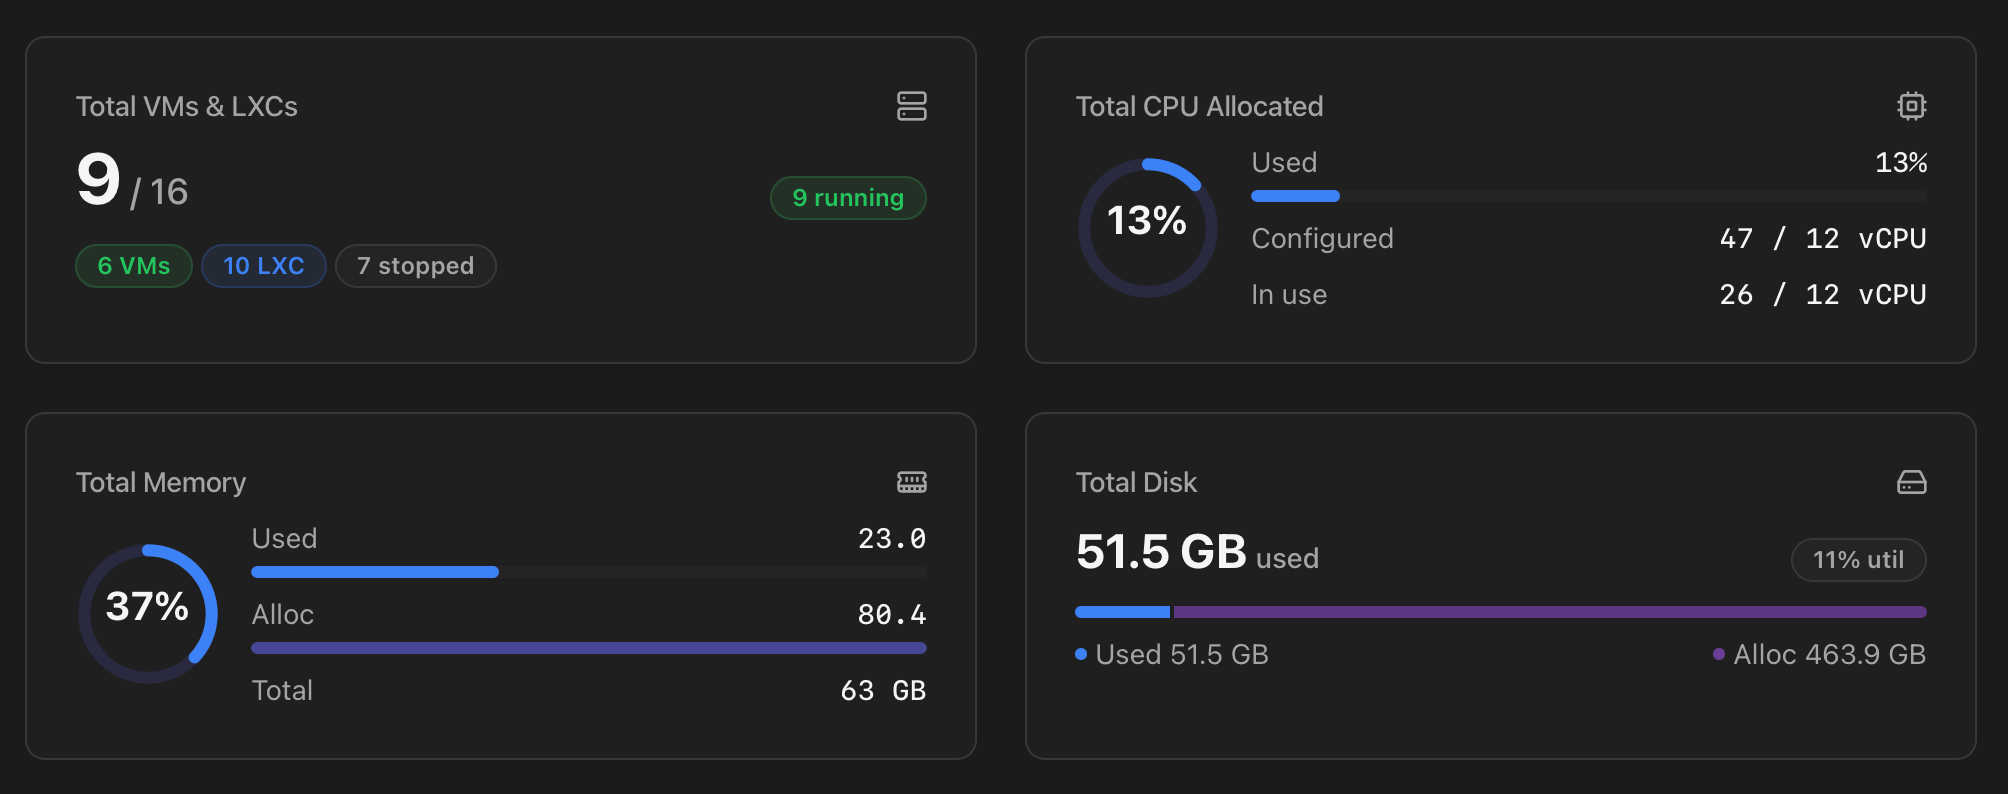
Inventory of running VMs and containers with resource usage and per-guest controls.
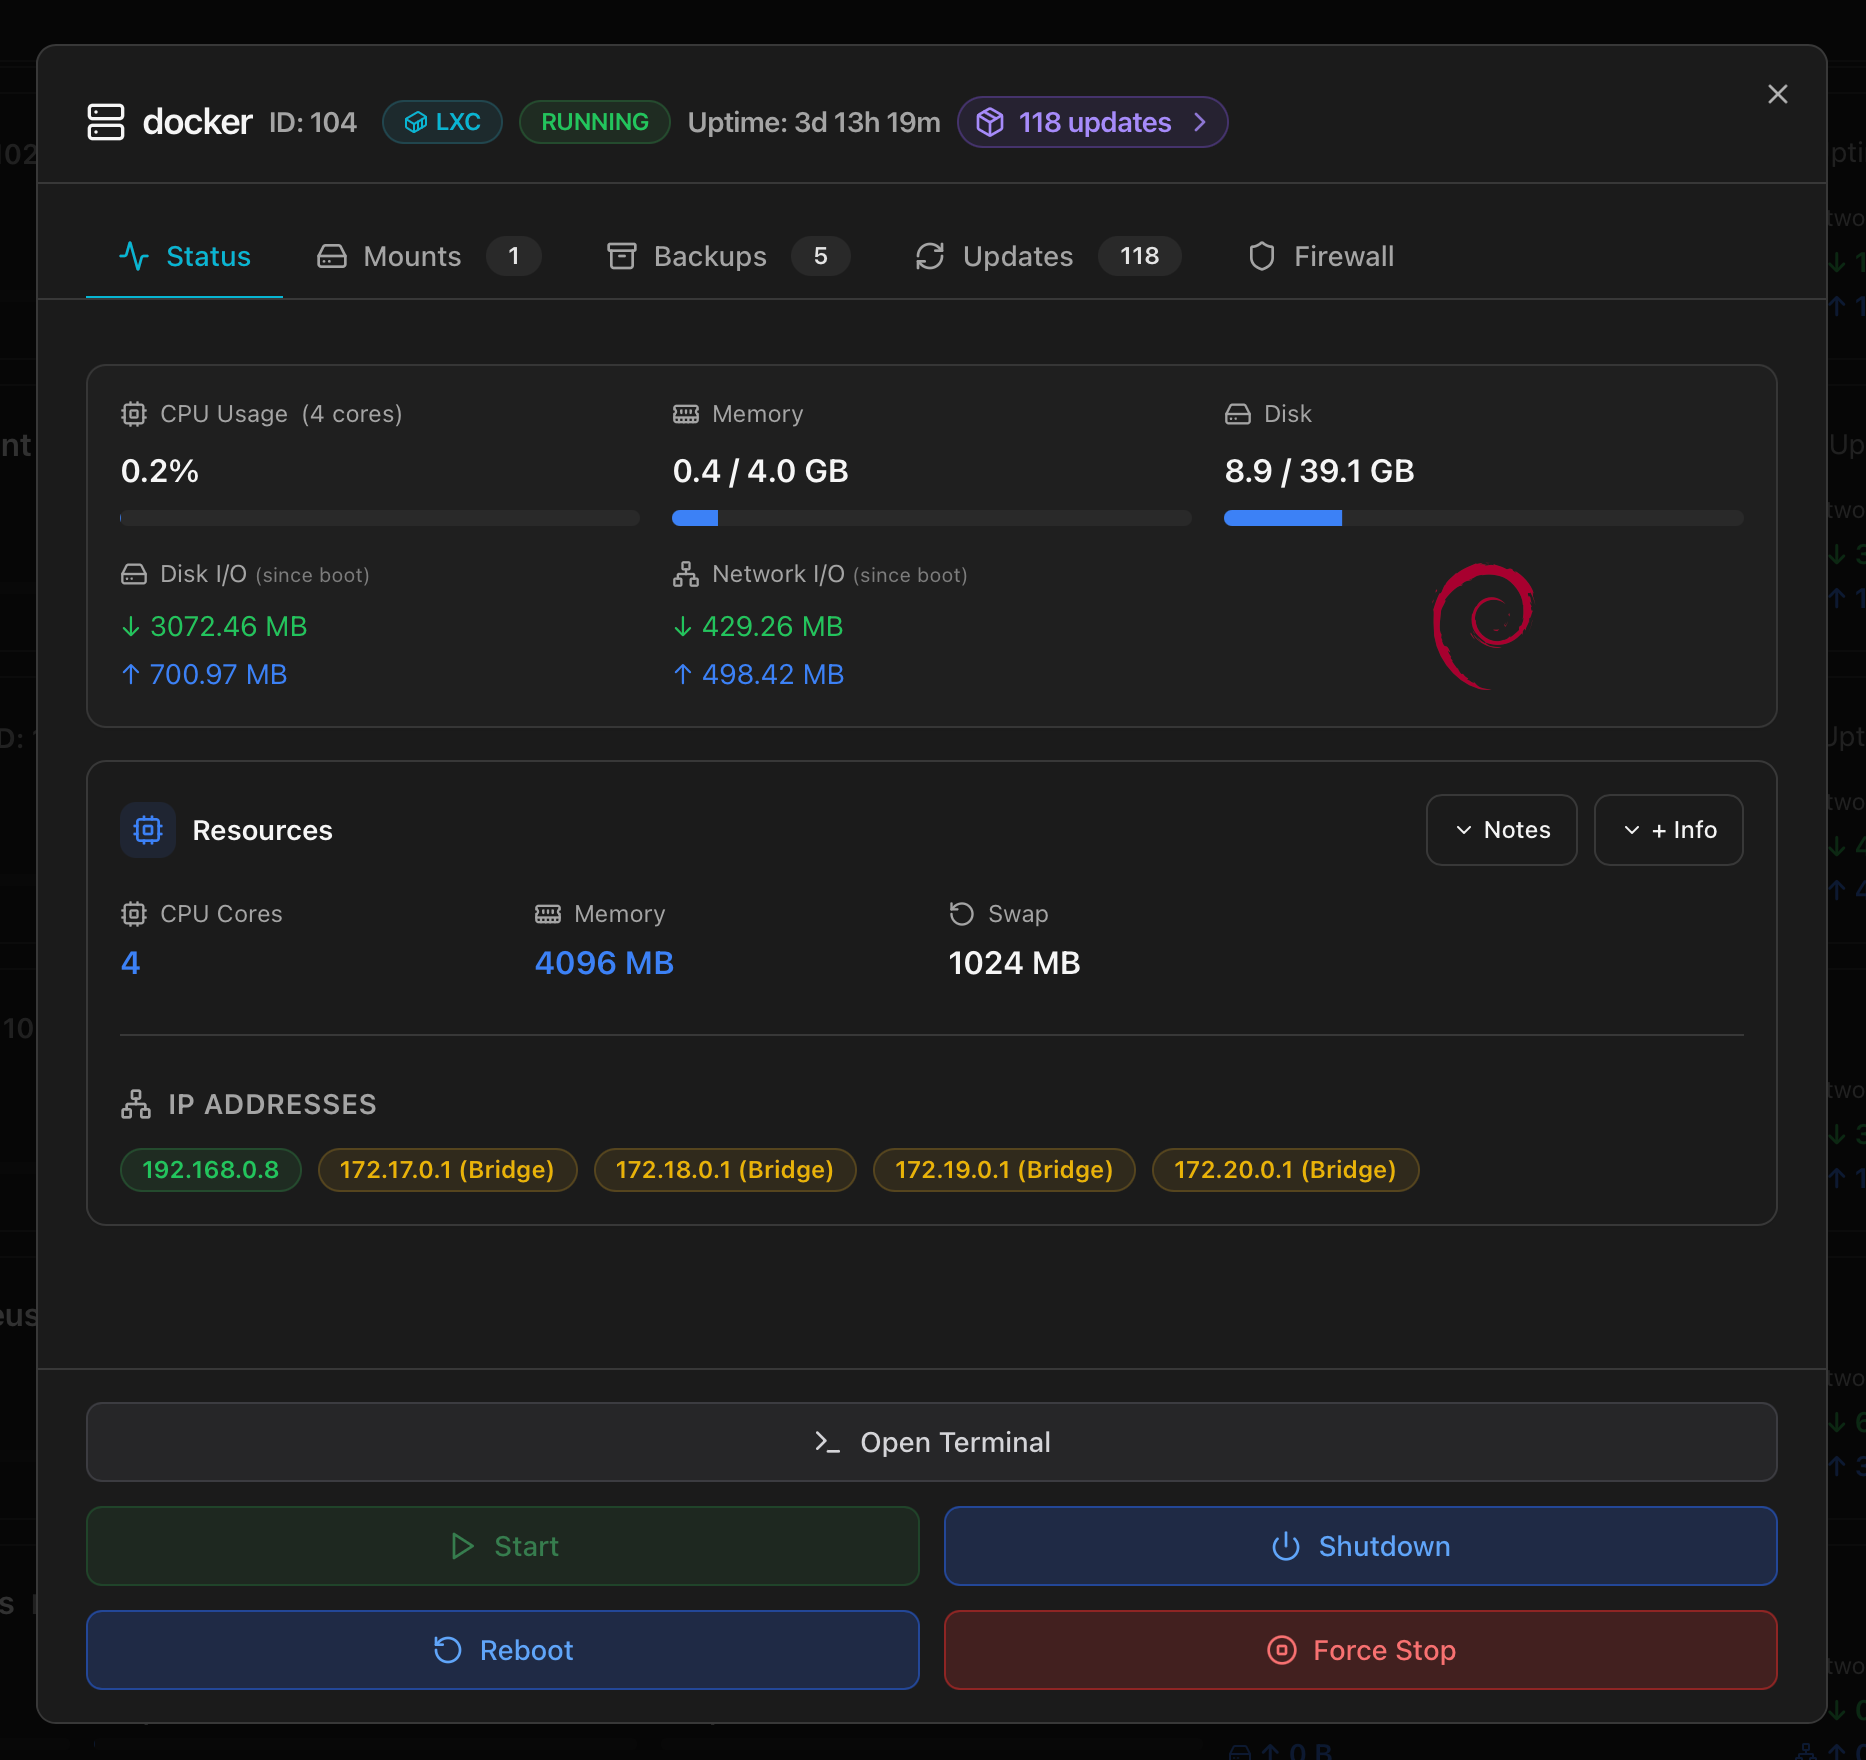
Per-guest modal with status, backups, mounts and (for LXC) apt / apk / community-scripts update inventory.
Health Monitor
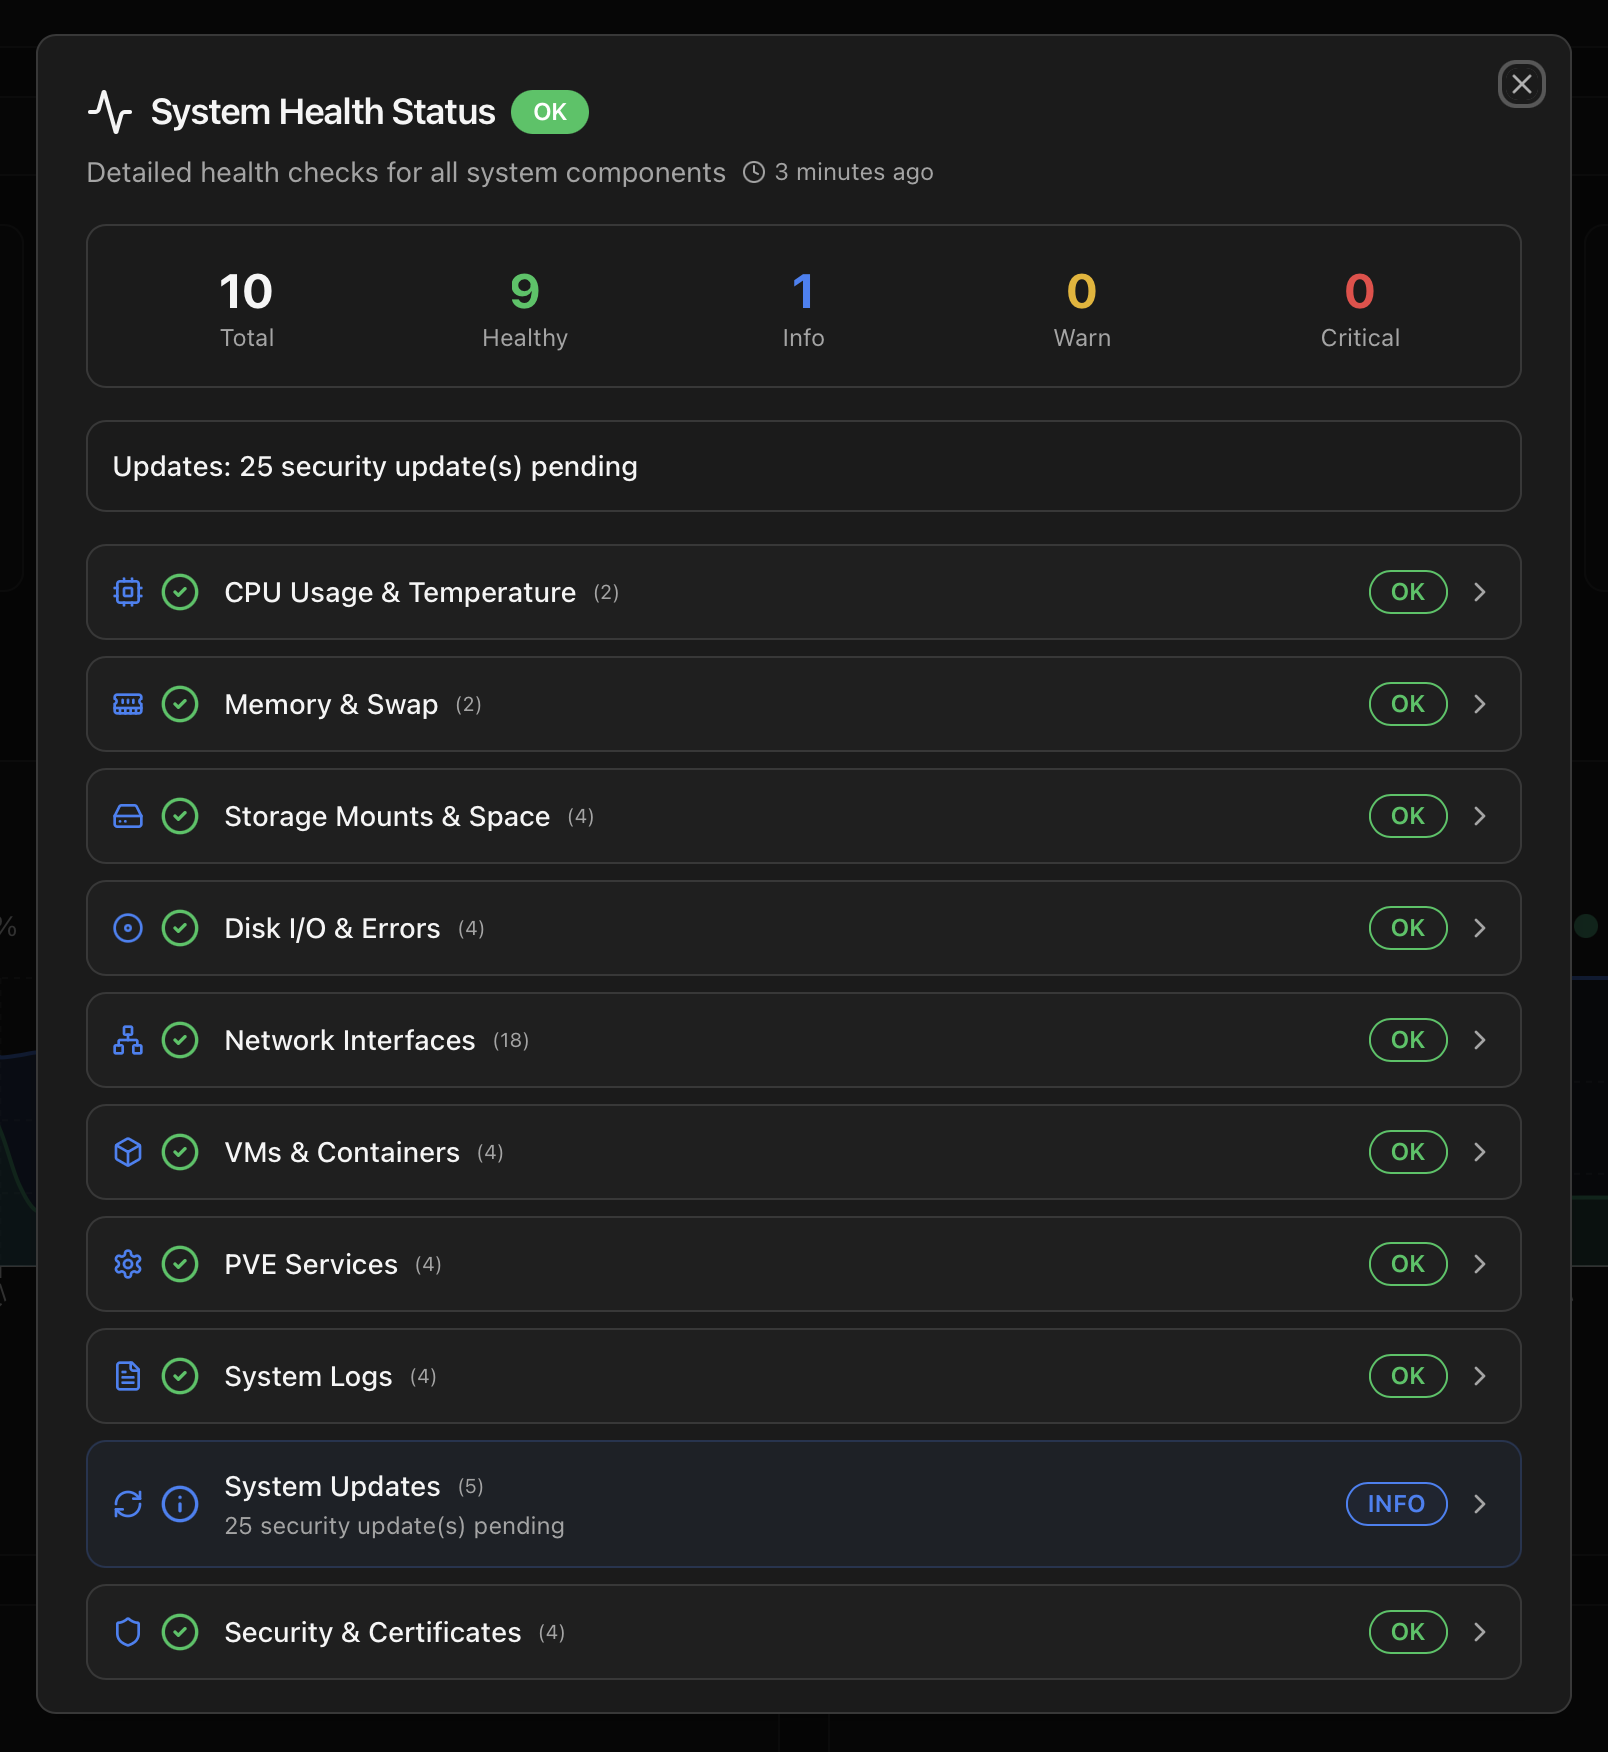
Ten categories of proactive health checks with hysteresis, per-error dismiss (24 h / 7 d / permanent) and an Active Suppressions panel to revoke.
System overview — top processes
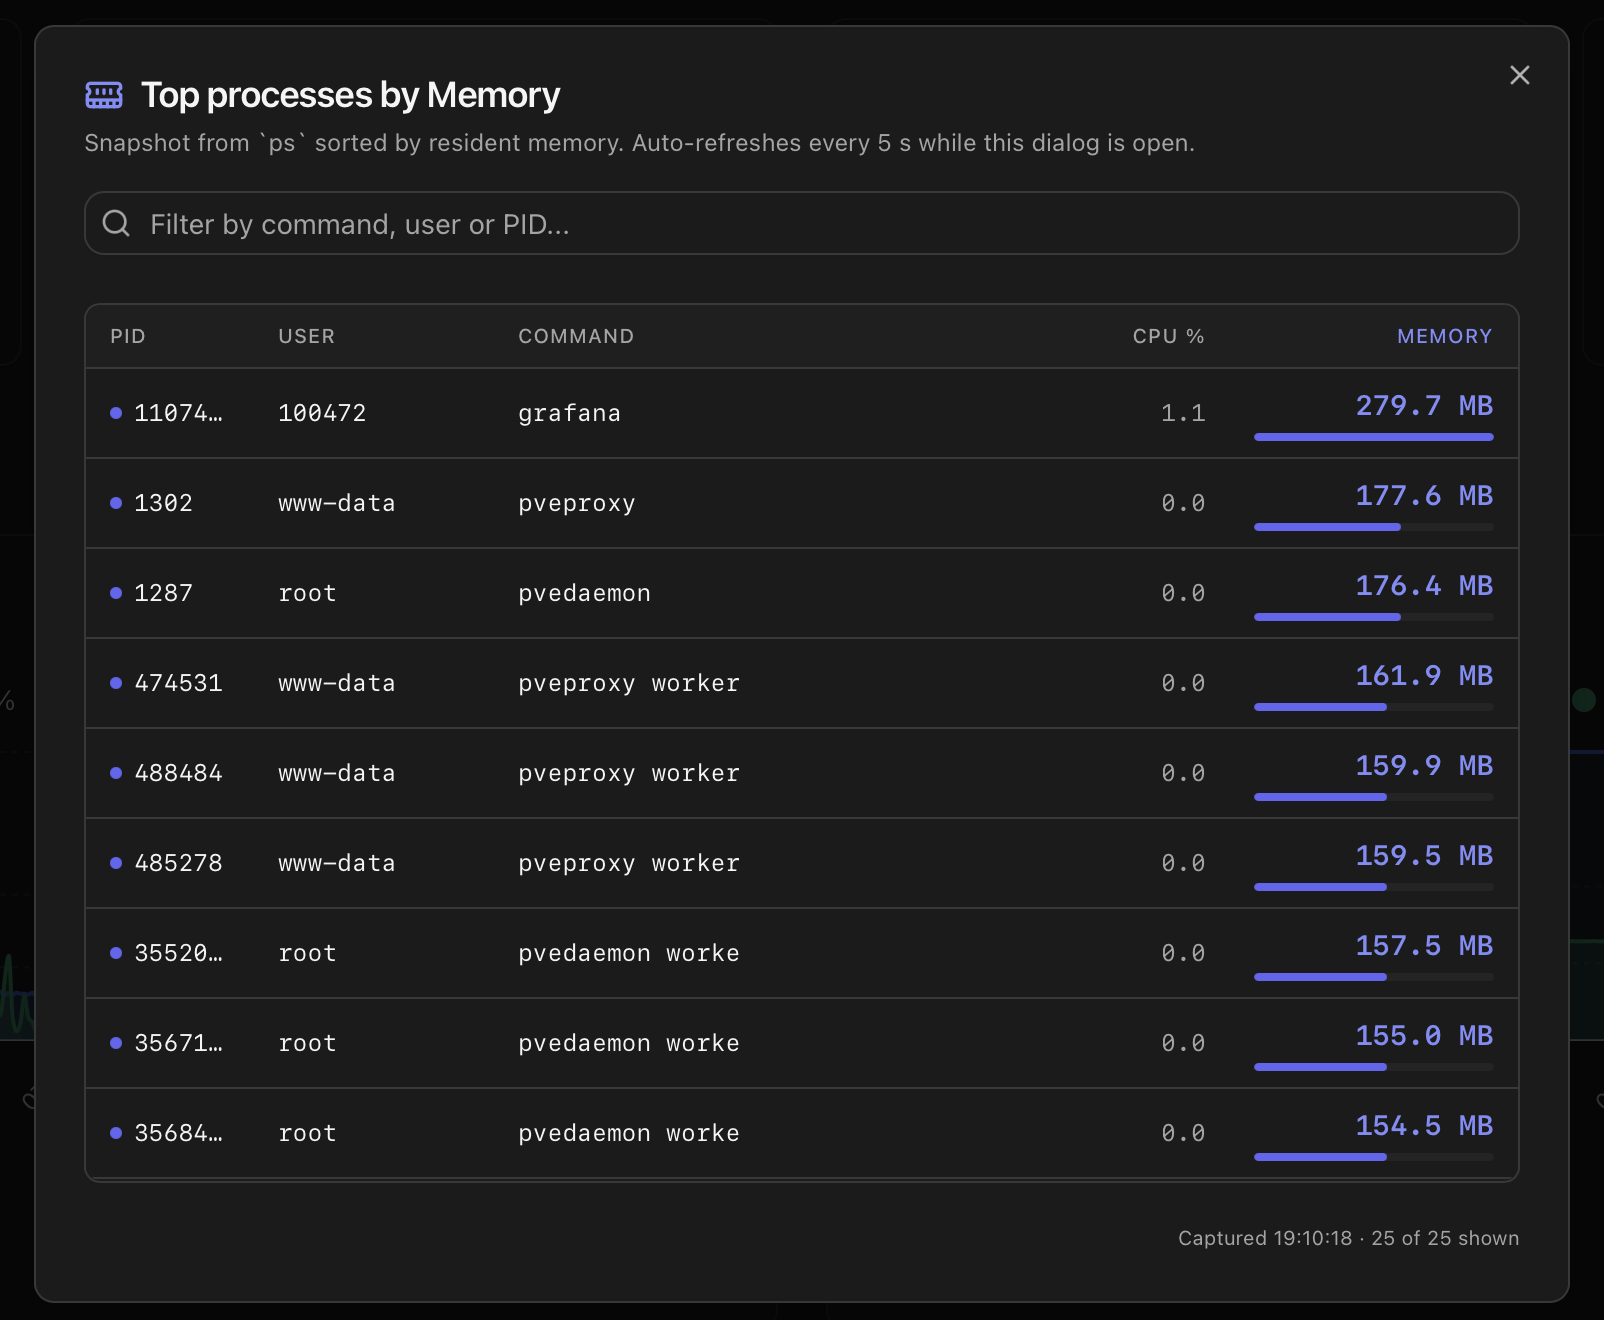
Per-process CPU / memory / I/O sorted by consumer, with a click-through detail modal.
Mobile
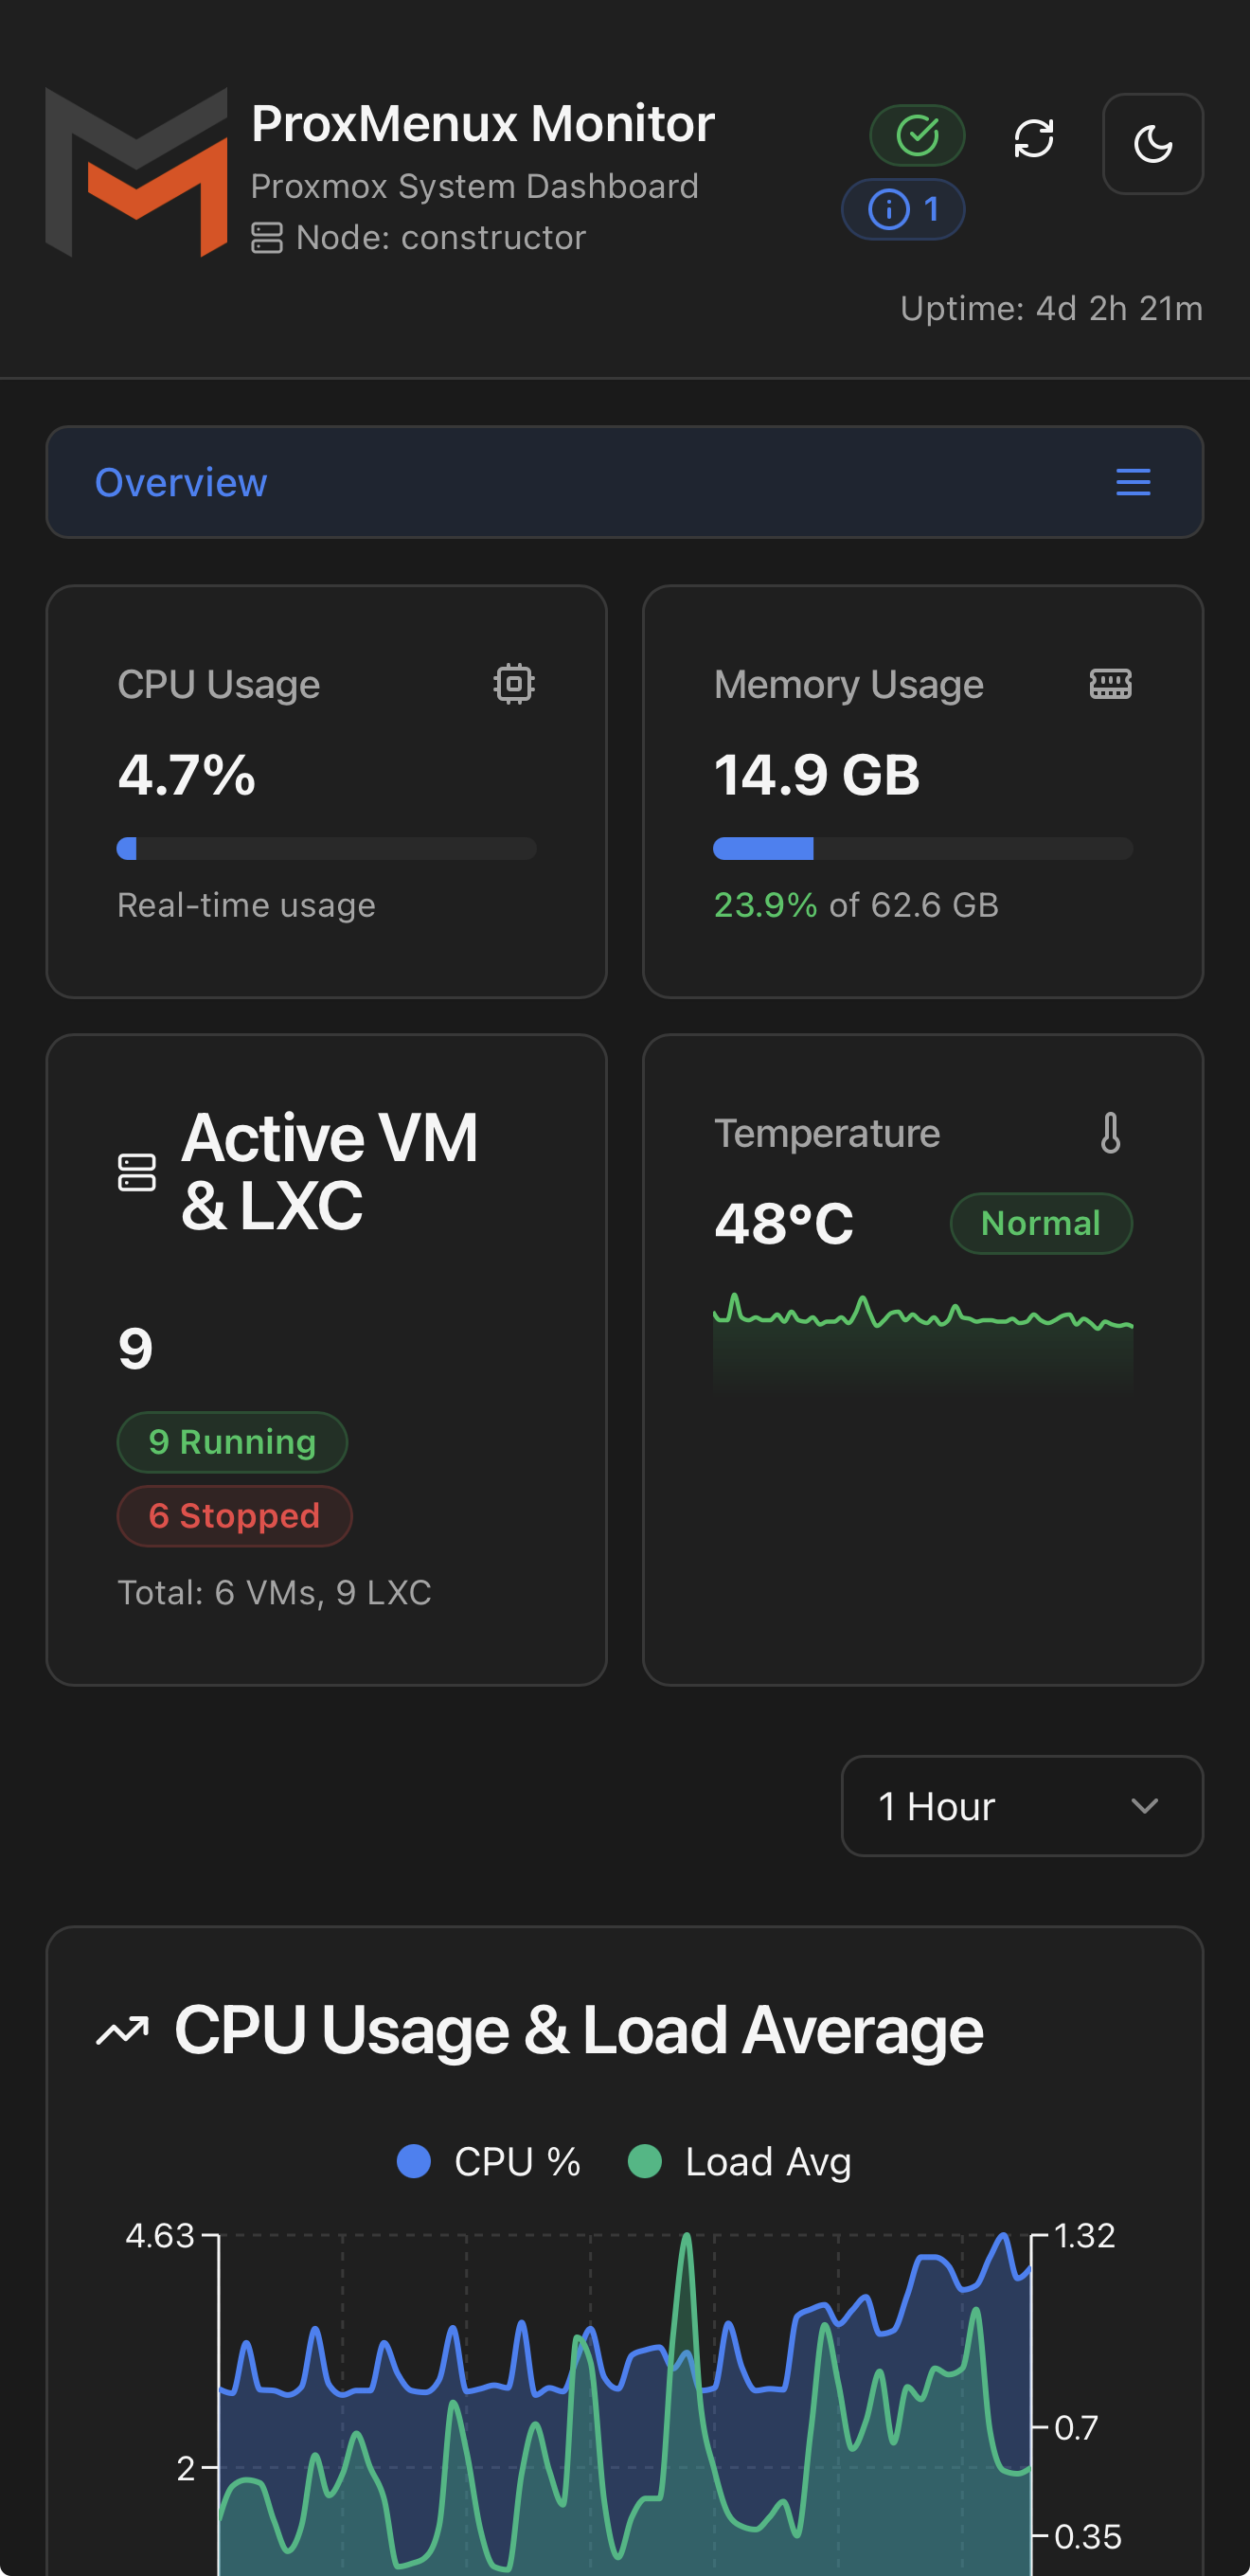
Fully responsive — every panel adapts to phone and tablet layouts.
Features
- Host Backup & Restore — integrated section covering Local, PBS and Borg destinations; schedule with a systemd timer or attach to an existing PVE vzdump job; PBS encryption with paired recovery blobs; direction-aware cross-kernel restore with kernel-agnostic hydration (IOMMU / VFIO / GRUB), cascade-safe package replay, and NIC auto-remap by MAC after a motherboard swap
- System Overview — real-time CPU / memory / temperature / uptime with a per-process drill-down (Top Processes view) and click-through detail modal
- Storage & SMART — per-disk cards in a responsive grid; temperature history, SMART attributes and a downloadable PDF SMART report per drive. USB-NVMe bridges (ASMedia / JMicron / Realtek) show the real drive's identity and temperature instead of the enclosure's
- Network — live topology (Network Flow) with animated rx / tx pulses, per-interface RRD charts, latency modal against Gateway / Cloudflare / Google with a downloadable PDF report
- Virtual Machines & LXCs — inventory, per-guest metrics and controls, per-LXC update inventory (apt / apk / community-scripts), backup state, mount inspection
- Hardware — CPU / GPU / PCIe / disks / NICs, with correct SSD vs HDD classification even behind USB-SATA bridges
- System Logs — journalctl with severity / since / free-text filters and a download-as-text action
- Health Monitor — ten categories of proactive checks with hysteresis and configurable thresholds; per-error dismiss (24 h / 7 d / permanent) and an Active Suppressions panel to revoke
- Notifications — five channels (Telegram, Discord, Gotify, Email, Apprise for ~80 endpoints), per-event toggles, Quiet Hours, Daily Digest, optional AI enrichment (Groq / OpenAI / Ollama / Gemini / Anthropic / OpenRouter)
- Authentication & 2FA — optional password protection with TOTP-based two-factor authentication and long-lived API tokens (365 days) for integrations
- RESTful API — complete access with JWT auth; ready-made recipes for Homepage, Home Assistant and custom dashboards; Prometheus scrape endpoint
- Reports (PDF) — SMART report per-disk and Network Latency report per-target, ready to send to a vendor or an ISP
- Dark / Light Theme — Proxmox-inspired palette with live switch
- Responsive Design — desktop, tablet and mobile layouts
- Release Notes — automatic notification of new features on each Monitor upgrade
Technology Stack
- Frontend: Next.js 15, React 19, TypeScript
- Styling: Tailwind CSS v4 with custom Proxmox-inspired theme
- Charts: Recharts for data visualization
- UI Components: Radix UI primitives with shadcn/ui
- Backend: Flask (Python) server for system data collection
- Packaging: AppImage for easy distribution and deployment
Installation
ProxMenux Monitor is integrated into ProxMenux and comes enabled by default. No manual installation is required if you're using ProxMenux.
The monitor automatically starts when ProxMenux is installed and runs as a systemd service on your Proxmox server.
Accessing the Dashboard
You can access ProxMenux Monitor in two ways:
- Direct Access:
http://your-proxmox-ip:8008 - Via Proxy (Recommended):
https://your-domain.com/proxmenux-monitor/
Note: All API endpoints work seamlessly with both direct access and proxy configurations. When using a reverse proxy, the application automatically detects and adapts to the proxied environment.
Proxy Configuration
ProxMenux Monitor includes built-in support for reverse proxy configurations. If you're using Nginx, Caddy, or Traefik, the application will automatically:
- Detect the proxy headers (
X-Forwarded-For,X-Forwarded-Proto,X-Forwarded-Host) - Adjust API endpoints to work correctly through the proxy
- Maintain full functionality for all features including authentication and API access
Authentication & Security
ProxMenux Monitor includes an optional authentication system to protect your dashboard with a password and two-factor authentication.
Setup Authentication
On first launch, you'll be presented with three options:
- Set up authentication - Create a username and password to protect your dashboard
- Enable 2FA - Add TOTP-based two-factor authentication for enhanced security
- Skip - Continue without authentication (not recommended for production environments)
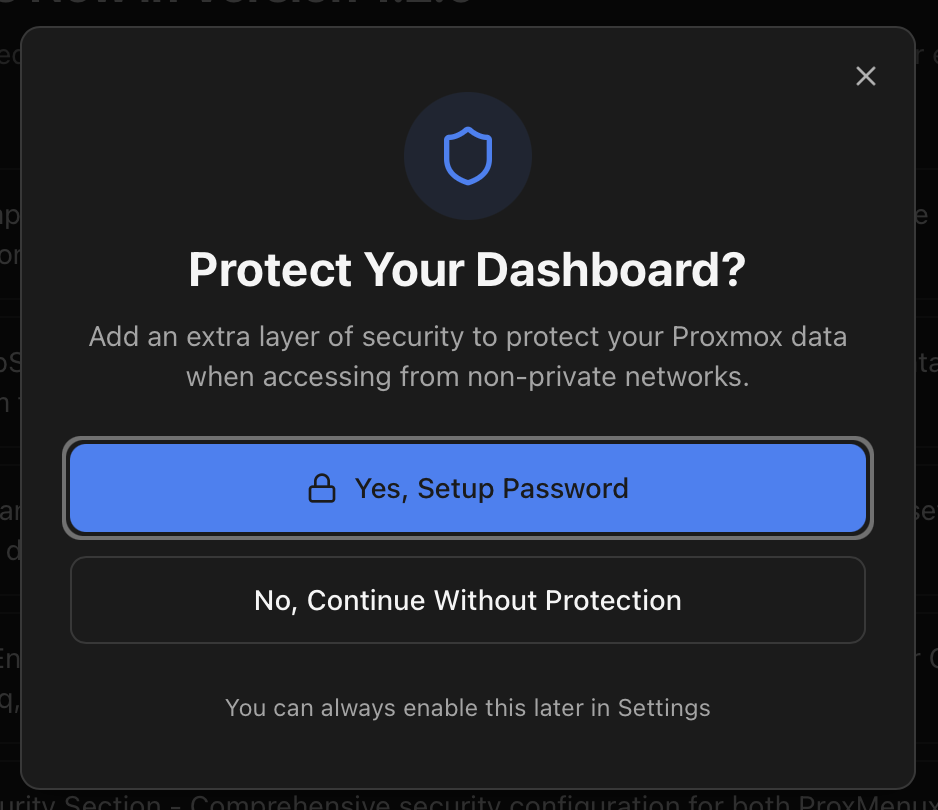
Two-Factor Authentication (2FA)
After setting up your password, you can enable 2FA using any TOTP authenticator app (Google Authenticator, Authy, 1Password, etc.):
- Navigate to Settings > Authentication
- Click Enable 2FA
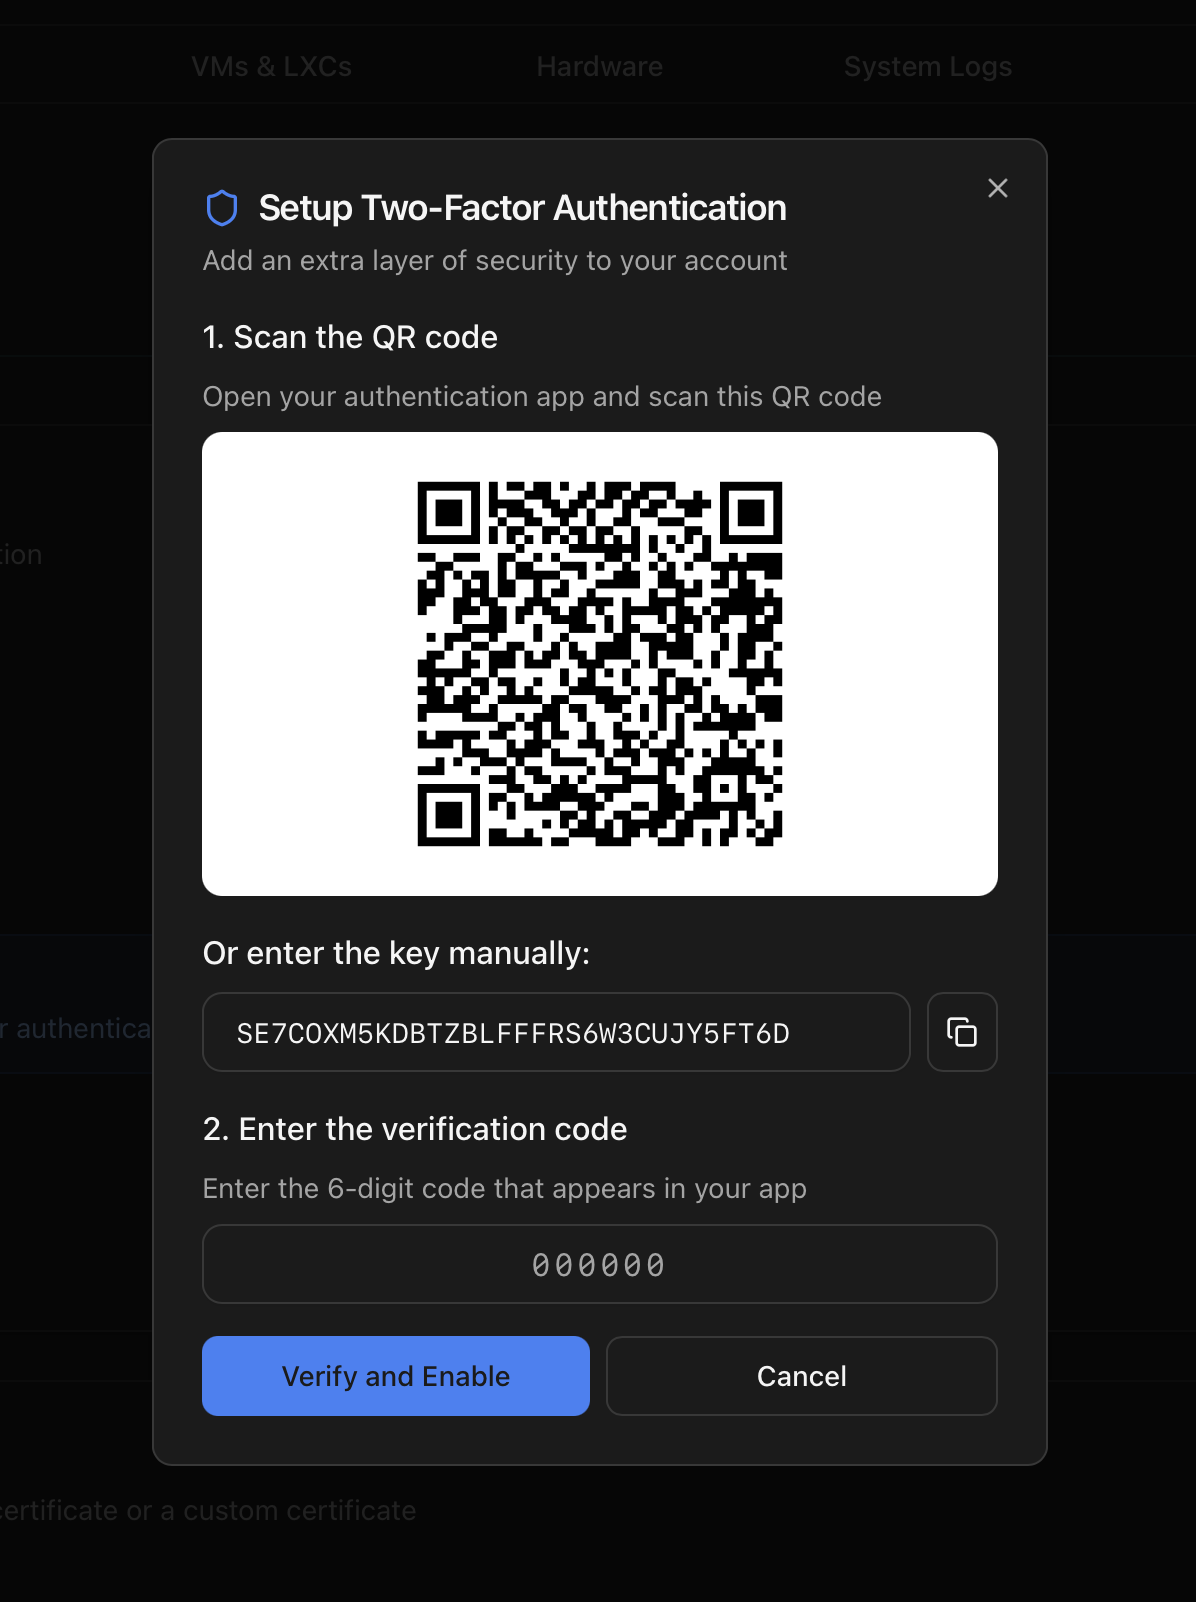
- Scan the QR code with your authenticator app
- Enter the 6-digit code to verify
- Save your backup codes in a secure location
Security Best Practices for API Tokens
IMPORTANT: Never hardcode your API tokens directly in configuration files or scripts. Instead, use environment variables or secrets management.
Option 1: Environment Variables
Store your token in an environment variable:
# Linux/macOS - Add to ~/.bashrc or ~/.zshrc
export PROXMENUX_API_TOKEN="your_actual_token_here"

# Windows PowerShell - Add to profile
$env:PROXMENUX_API_TOKEN = "your_actual_token_here"
Then reference it in your scripts:
# Linux/macOS
curl -H "Authorization: Bearer $PROXMENUX_API_TOKEN" \
  http://your-proxmox-ip:8008/api/system

# Windows PowerShell
curl -H "Authorization: Bearer $env:PROXMENUX_API_TOKEN" `
  http://your-proxmox-ip:8008/api/system
Option 2: Secrets File
Create a dedicated secrets file (make sure to add it to .gitignore):
# Create secrets file
echo "PROXMENUX_API_TOKEN=your_actual_token_here" > ~/.proxmenux_secrets

# Secure the file (Linux/macOS only)
chmod 600 ~/.proxmenux_secrets

# Load in your script
source ~/.proxmenux_secrets
Option 3: Homepage Secrets (Recommended)
Homepage supports secrets management. Create a secrets.yaml file:
# secrets.yaml (add to .gitignore!)
proxmenux_token: "your_actual_token_here"
Then reference it in your services.yaml:
- ProxMenux Monitor:
    widget:
      type: customapi
      url: http://proxmox.example.tld:8008/api/system
      headers:
        Authorization: Bearer {{HOMEPAGE_VAR_PROXMENUX_TOKEN}}
Option 4: Home Assistant Secrets
Home Assistant has built-in secrets support. Edit secrets.yaml:
# secrets.yaml
proxmenux_api_token: "your_actual_token_here"
Then reference it in configuration.yaml:
sensor:
  - platform: rest
    name: ProxMenux CPU
    resource: http://proxmox.example.tld:8008/api/system
    headers:
      Authorization: !secret proxmenux_api_token
Token Security Checklist:
- ✅ Store tokens in environment variables or secrets files
- ✅ Add secrets files to
.gitignore - ✅ Set proper file permissions (chmod 600 on Linux/macOS)
- ✅ Rotate tokens periodically (every 3-6 months)
- ✅ Use different tokens for different integrations
- ✅ Delete tokens you no longer use
- ❌ Never commit tokens to version control
- ❌ Never share tokens in screenshots or logs
- ❌ Never hardcode tokens in configuration files
API Documentation
ProxMenux Monitor provides a comprehensive RESTful API for integrating with external services like Homepage, Home Assistant, or custom dashboards.
API Authentication
When authentication is enabled on ProxMenux Monitor, all API endpoints (except /api/health and /api/auth/*) require a valid JWT token in the Authorization header.
API Endpoint Base URL
Direct Access:
http://your-proxmox-ip:8008/api/
Via Proxy:
https://your-domain.com/proxmenux-monitor/api/
Note: All API examples in this documentation work with both direct and proxied URLs. Simply replace the base URL with your preferred access method.
Generating API Tokens
To use the API with authentication enabled, you need to generate a long-lived API token.
Option 1: Generate via Web Panel (Recommended)
The easiest way to generate an API token is through the ProxMenux Monitor web interface:
- Navigate to Settings tab in the dashboard
- Scroll to the API Access Tokens section
- Enter your password
- If 2FA is enabled, enter your 6-digit code
- Provide a name for the token (e.g., "Homepage Integration")
- Click Generate Token
- Copy the token immediately - it will not be shown again
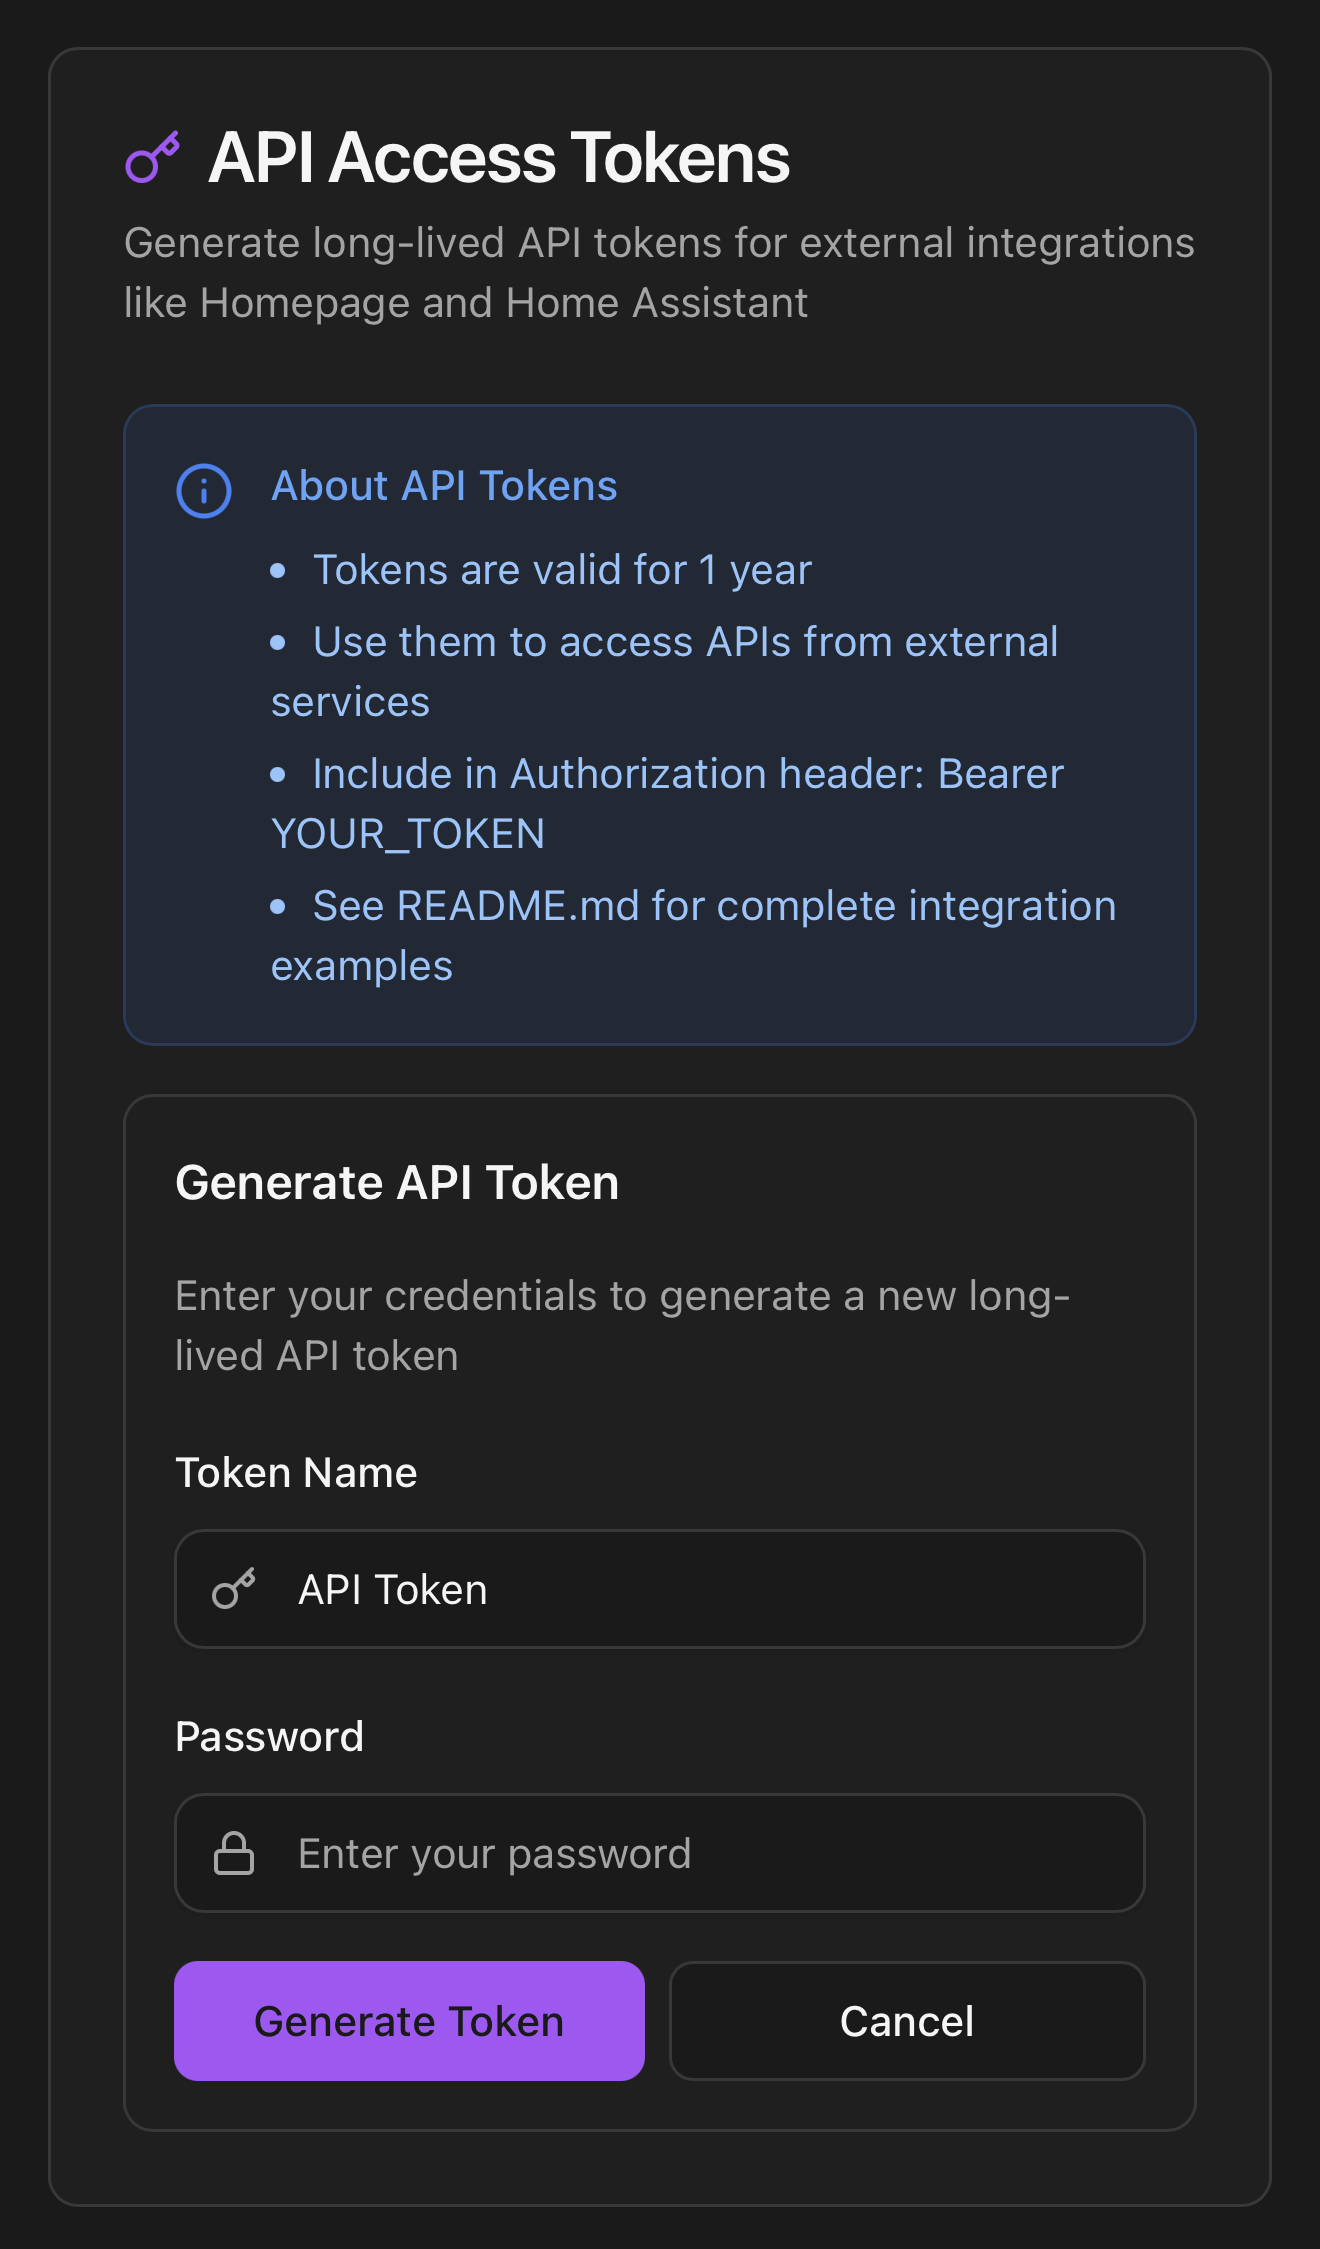
The token will be valid for 365 days (1 year) and can be used for integrations with Homepage, Home Assistant, or any custom application.
Option 2: Generate via API Call
For advanced users or automation, you can generate tokens programmatically:
curl -X POST http://your-proxmox-ip:8008/api/auth/generate-api-token \
  -H "Content-Type: application/json" \
  -d '{
    "username": "your-username",
    "password": "your-password",
    "totp_token": "123456",
    "token_name": "Homepage Integration"
  }'
Response:
{
  "success": true,
  "token": "eyJhbGciOiJIUzI1NiIsInR5cCI6IkpXVCJ9...",
  "token_name": "Homepage Integration",
  "expires_in": "365 days",
  "message": "API token generated successfully. Store this token securely, it will not be shown again."
}
Notes:
- If 2FA is enabled, include the
totp_tokenfield with your 6-digit code - If 2FA is not enabled, omit the
totp_tokenfield - The token is valid for 365 days (1 year)
- Store the token securely - it cannot be retrieved again
Option 3: Generate via cURL (without 2FA)
# Without 2FA
curl -X POST http://your-proxmox-ip:8008/api/auth/generate-api-token \
  -H "Content-Type: application/json" \
  -d '{"username":"pedro","password":"your-password","token_name":"Homepage"}'
Using API Tokens
Once you have your API token, include it in the Authorization header of all API requests:
curl -H "Authorization: Bearer YOUR_API_TOKEN_HERE" \
  http://your-proxmox-ip:8008/api/system
Available Endpoints
Below is a complete list of all API endpoints with descriptions and example responses.
System & Metrics
| Endpoint | Method | Auth Required | Description |
|---|---|---|---|
/api/system |
GET | Yes | Complete system information (CPU, memory, temperature, uptime) |
/api/system-info |
GET | No | Lightweight system info for header (hostname, uptime, health) |
/api/node/metrics |
GET | Yes | Historical metrics data (RRD) for CPU, memory, disk I/O |
/api/prometheus |
GET | Yes | Export metrics in Prometheus format |
Example /api/system Response:
{
  "hostname": "pve",
  "cpu_usage": 15.2,
  "memory_usage": 45.8,
  "temperature": 42.5,
  "uptime": 345600,
  "kernel": "6.2.16-3-pve",
  "pve_version": "8.0.3"
}
Storage
| Endpoint | Method | Auth Required | Description |
|---|---|---|---|
/api/storage |
GET | Yes | Complete storage information with SMART data |
/api/storage/summary |
GET | Yes | Optimized storage summary (without SMART) |
/api/proxmox-storage |
GET | Yes | Proxmox storage pools information |
/api/backups |
GET | Yes | List of all backup files |
Example /api/storage/summary Response:
{
  "total_capacity": 1431894917120,
  "used_space": 197414092800,
  "free_space": 1234480824320,
  "usage_percentage": 13.8,
  "disks": [
    {
      "device": "/dev/sda",
      "model": "Samsung SSD 970",
      "size": "476.94 GB",
      "type": "SSD"
    }
  ]
}
Network
| Endpoint | Method | Auth Required | Description |
|---|---|---|---|
/api/network |
GET | Yes | Complete network information for all interfaces |
/api/network/summary |
GET | Yes | Optimized network summary |
/api/network/<interface>/metrics |
GET | Yes | Historical metrics (RRD) for specific interface |
Example /api/network/summary Response:
{
  "interfaces": [
    {
      "name": "vmbr0",
      "ip": "192.168.1.100",
      "state": "up",
      "rx_bytes": 1234567890,
      "tx_bytes": 987654321
    }
  ]
}
Virtual Machines & Containers
| Endpoint | Method | Auth Required | Description |
|---|---|---|---|
/api/vms |
GET | Yes | List of all VMs and LXC containers |
/api/vms/<vmid> |
GET | Yes | Detailed configuration for specific VM/LXC |
/api/vms/<vmid>/metrics |
GET | Yes | Historical metrics (RRD) for specific VM/LXC |
/api/vms/<vmid>/logs |
GET | Yes | Download real logs for specific VM/LXC |
/api/vms/<vmid>/control |
POST | Yes | Control VM/LXC (start, stop, shutdown, reboot) |
/api/vms/<vmid>/config |
PUT | Yes | Update VM/LXC configuration (description/notes) |
Example /api/vms Response:
{
  "vms": [
    {
      "vmid": "100",
      "name": "ubuntu-server",
      "type": "qemu",
      "status": "running",
      "cpu": 2,
      "maxcpu": 4,
      "mem": 2147483648,
      "maxmem": 4294967296,
      "uptime": 86400
    }
  ]
}
Hardware
| Endpoint | Method | Auth Required | Description |
|---|---|---|---|
/api/hardware |
GET | Yes | Complete hardware information (CPU, GPU, PCIe, disks) |
/api/gpu/<slot>/realtime |
GET | Yes | Real-time monitoring for specific GPU |
Example /api/hardware Response:
{
  "cpu": {
    "model": "AMD Ryzen 9 5950X",
    "cores": 16,
    "threads": 32,
    "frequency": "3.4 GHz"
  },
  "gpus": [
    {
      "slot": "0000:01:00.0",
      "vendor": "NVIDIA",
      "model": "GeForce RTX 3080",
      "driver": "nvidia"
    }
  ]
}
Logs, Events & Notifications
| Endpoint | Method | Auth Required | Description |
|---|---|---|---|
/api/logs |
GET | Yes | System logs (journalctl) with filters |
/api/logs/download |
GET | Yes | Download logs as text file |
/api/notifications |
GET | Yes | Proxmox notification history |
/api/notifications/download |
GET | Yes | Download full notification log |
/api/events |
GET | Yes | Recent Proxmox tasks and events |
/api/task-log/<upid> |
GET | Yes | Full log for specific task using UPID |
Example /api/logs Query Parameters:
/api/logs?severity=error&since=1h&search=failed
Health Monitoring
| Endpoint | Method | Auth Required | Description |
|---|---|---|---|
/api/health |
GET | No | Basic health check (for external monitoring) |
/api/health/status |
GET | Yes | Summary of system health status |
/api/health/details |
GET | Yes | Detailed health check results |
/api/health/acknowledge |
POST | Yes | Dismiss/acknowledge health warnings |
/api/health/active-errors |
GET | Yes | Get active persistent errors |
ProxMenux Optimizations
| Endpoint | Method | Auth Required | Description |
|---|---|---|---|
/api/proxmenux/installed-tools |
GET | Yes | List of installed ProxMenux optimizations |
Authentication
| Endpoint | Method | Auth Required | Description |
|---|---|---|---|
/api/auth/status |
GET | No | Current authentication status |
/api/auth/login |
POST | No | Authenticate and receive JWT token |
/api/auth/generate-api-token |
POST | No | Generate long-lived API token (365 days) |
/api/auth/setup |
POST | No | Initial setup of username/password |
/api/auth/enable |
POST | No | Enable authentication |
/api/auth/disable |
POST | Yes | Disable authentication |
/api/auth/change-password |
POST | No | Change password |
/api/auth/totp/setup |
POST | Yes | Initialize 2FA setup |
/api/auth/totp/enable |
POST | Yes | Enable 2FA after verification |
/api/auth/totp/disable |
POST | Yes | Disable 2FA |
Integration Examples
Homepage Integration
Homepage is a modern, fully static, fast, secure fully proxied, highly customizable application dashboard.
Basic Configuration (No Authentication)
- ProxMenux Monitor:
    href: http://proxmox.example.tld:8008/
    icon: lucide:flask-round
    widget:
      type: customapi
      url: http://proxmox.example.tld:8008/api/system
      refreshInterval: 10000
      mappings:
        - field: uptime
          label: Uptime
          icon: lucide:clock-4
          format: text
        - field: cpu_usage
          label: CPU
          icon: lucide:cpu
          format: percent
        - field: memory_usage
          label: RAM
          icon: lucide:memory-stick
          format: percent
        - field: temperature
          label: Temp
          icon: lucide:thermometer-sun
          format: number
          suffix: °C
With Authentication Enabled (Using Secrets)
First, generate an API token via the web interface (Settings > API Access Tokens) or via API.
Then, store your token securely in Homepage's secrets.yaml:
# secrets.yaml (add to .gitignore!)
proxmenux_token: "your_actual_api_token_here"
Finally, reference the secret in your services.yaml:
- ProxMenux Monitor:
    href: http://proxmox.example.tld:8008/
    icon: lucide:flask-round
    widget:
      type: customapi
      url: http://proxmox.example.tld:8008/api/system
      headers:
        Authorization: Bearer {{HOMEPAGE_VAR_PROXMENUX_TOKEN}}
      refreshInterval: 10000
      mappings:
        - field: uptime
          label: Uptime
          icon: lucide:clock-4
          format: text
        - field: cpu_usage
          label: CPU
          icon: lucide:cpu
          format: percent
        - field: memory_usage
          label: RAM
          icon: lucide:memory-stick
          format: percent
        - field: temperature
          label: Temp
          icon: lucide:thermometer-sun
          format: number
          suffix: °C
Advanced Multi-Widget Configuration
# Store token in secrets.yaml
# proxmenux_token: "your_actual_api_token_here"

- ProxMenux System:
    href: http://proxmox.example.tld:8008/
    icon: lucide:server
    description: Proxmox VE Host
    widget:
      type: customapi
      url: http://proxmox.example.tld:8008/api/system
      headers:
        Authorization: Bearer {{HOMEPAGE_VAR_PROXMENUX_TOKEN}}
      refreshInterval: 5000
      mappings:
        - field: cpu_usage
          label: CPU
          icon: lucide:cpu
          format: percent
        - field: memory_usage
          label: RAM
          icon: lucide:memory-stick
          format: percent
        - field: temperature
          label: Temp
          icon: lucide:thermometer-sun
          format: number
          suffix: °C

- ProxMenux Storage:
    href: http://proxmox.example.tld:8008/#/storage
    icon: lucide:hard-drive
    description: Storage Overview
    widget:
      type: customapi
      url: http://proxmox.example.tld:8008/api/storage/summary
      headers:
        Authorization: Bearer {{HOMEPAGE_VAR_PROXMENUX_TOKEN}}
      refreshInterval: 30000
      mappings:
        - field: usage_percentage
          label: Used
          icon: lucide:database
          format: percent
        - field: used_space
          label: Space
          icon: lucide:folder
          format: bytes

- ProxMenux Network:
    href: http://proxmox.example.tld:8008/#/network
    icon: lucide:network
    description: Network Stats
    widget:
      type: customapi
      url: http://proxmox.example.tld:8008/api/network/summary
      headers:
        Authorization: Bearer {{HOMEPAGE_VAR_PROXMENUX_TOKEN}}
      refreshInterval: 5000
      mappings:
        - field: interfaces[0].rx_bytes
          label: Received
          icon: lucide:download
          format: bytes
        - field: interfaces[0].tx_bytes
          label: Sent
          icon: lucide:upload
          format: bytes
Home Assistant Integration
Home Assistant is an open-source home automation platform.
Store Token Securely
First, add your API token to Home Assistant's secrets.yaml:
# secrets.yaml
proxmenux_api_token: "Bearer your_actual_api_token_here"
Note: Include "Bearer " prefix in the secrets file for Home Assistant.
Configuration.yaml
# ProxMenux Monitor Sensors
sensor:
  - platform: rest
    name: ProxMenux CPU
    resource: http://proxmox.example.tld:8008/api/system
    headers:
      Authorization: !secret proxmenux_api_token
    value_template: "{{ value_json.cpu_usage }}"
    unit_of_measurement: "%"
    scan_interval: 30

  - platform: rest
    name: ProxMenux Memory
    resource: http://proxmox.example.tld:8008/api/system
    headers:
      Authorization: !secret proxmenux_api_token
    value_template: "{{ value_json.memory_usage }}"
    unit_of_measurement: "%"
    scan_interval: 30

  - platform: rest
    name: ProxMenux Temperature
    resource: http://proxmox.example.tld:8008/api/system
    headers:
      Authorization: !secret proxmenux_api_token
    value_template: "{{ value_json.temperature }}"
    unit_of_measurement: "°C"
    device_class: temperature
    scan_interval: 30

  - platform: rest
    name: ProxMenux Uptime
    resource: http://proxmox.example.tld:8008/api/system
    headers:
      Authorization: !secret proxmenux_api_token
    value_template: >
      {% set uptime_seconds = value_json.uptime | int %}
      {% set days = (uptime_seconds / 86400) | int %}
      {% set hours = ((uptime_seconds % 86400) / 3600) | int %}
      {% set minutes = ((uptime_seconds % 3600) / 60) | int %}
      {{ days }}d {{ hours }}h {{ minutes }}m
    scan_interval: 60
Lovelace Card Example
type: entities
title: Proxmox Monitor
entities:
  - entity: sensor.proxmenux_cpu
    name: CPU Usage
    icon: mdi:cpu-64-bit
  - entity: sensor.proxmenux_memory
    name: Memory Usage
    icon: mdi:memory
  - entity: sensor.proxmenux_temperature
    name: Temperature
    icon: mdi:thermometer
  - entity: sensor.proxmenux_uptime
    name: Uptime
    icon: mdi:clock-outline
License
This project is licensed under the GNU General Public License, version 3 (GPL-3.0).
You are free to use, study, share and modify the software under the terms of the licence. Any distributed derivative work must be licensed under the same terms and include the full source code — see the full licence text or the LICENSE file at the repository root.
ProxMenux Monitor - Made with ❤️ for the Proxmox community